Download
1 / 40
400 likes | 710 Views
CSC 5712 (2014-2015). Performance of e-business systems. Instructor : Prof. Y. S. MOON ysmoon@cse.cuhk.edu.hk Tutor: Mr. Edward Fung edwardfung123@gmail.com. Course homepage: http://appsrv.cse.cuhk.edu.hk/~cmsc5712/. Evaluation Scheme. Assignments (3-4) 50% Final Examination 50%.

E N D
CSC 5712 (2014-2015) Performance of e-business systems Instructor: Prof. Y. S. MOON ysmoon@cse.cuhk.edu.hk Tutor: Mr. Edward Fung edwardfung123@gmail.com Course homepage: http://appsrv.cse.cuhk.edu.hk/~cmsc5712/
Evaluation Scheme • Assignments (3-4) 50% • Final Examination 50%
Topics e-Business • Models and Scaling of for e-Business • A Customer Behaviour Model • The Anatomy of e-Business Functions Payment Methods • A Quantitative Analysis of Authentication Services • A Quantitative Analysis of Payment Services Modelling of e-Business • A Capacity Planning Methodology for e-Business • Modeling Communication Networks • Solving Performance Models of e-Business Sites • Modeling Contention for Software Servers Aftermath • Characterizing e-Business Workloads • Preparing e-Business for Waves of Demand
Scaling for e-Business Chapter 1 Models for e-Business
Topics • Introduction - Electronic Business Challenges, Quantitative Approach • Electronic Markets - markets, players, B2B, B2C • Models for Electronic Business - Business, Functional, Customer and Resource Models • Quality of Service • Quantitative Approach
Understanding e-Business • Definition: • any form of business transaction in which the parties interact electronically • transactions represents a number of interactions between parties, such as marketing, ordering, payment, and support for delivery • Three functions: • Matching buyers and sellers (Marketing) • Facilitating commercial transactions (Deal) • Providing legal infrastructure (Support)
e-market—New Challenges • Improved Technologies: Smartphones, Tablets and fast local access technology (e.g. 3/4G, Wifi, apps) change the characteristics and intensity of Internet traffic • Understanding the impacts of new workloads in order to properly design and operate e-commerce systems
e-market • IT permeates all three functions (Matching, transactions, legal infrastructure), increases market efficiency and reduces transaction costs • The ways to help the interaction between participants: • Search • Valuation • Logistics • Payment • Authentication
e-markets--players • Major players in an electronic market include: • Businesses • Individuals • Government organizations
e-market—games & players • Business-to-Consumer (B2C) • Electronic retailing, such as online financial services, online publishing and etc • Government-to-Business (G2B) • All transactions between companies and government organizations, such as government electronic procurements, electronic payment of corporate taxes and etc • Government-to-Citizens (G2C) • Electronic interactions between citizens and government, such as welfare payments and tax returns
e-Business Examples 1 • Information B2C market • Function: match customers and sellers, act as the distribution channel, deliver product to customers • The infrastructure must support the delivery of large files, streaming media, and other types of digital goods • An opensystem where the number of participants is unknown • Automobile B2B market • A closedmarket where the number of participants is limited and known a priori • Function: trade products with high specificity, such as parts and components of cars; involves the exchange of standardized, structured information between organizations • The infrastructure should integrate Web-based applications with mainframe and legacy system
e-Business Examples 2 • B2C reflects only the interactions between a customer and a retailer, i.e. account acquisition, product discovery through search and browse, price negotiation, payment and product delivery • B2B interactions involve much more complexity than B2C. B2B covers business transactions along various interactions existing in the value chain
e-Business Examples 3 • Typical B2B transactions includes: • review catalogs • identify specifications • define requirements • post request for proposals(RFP) • review vendor reputation • select vendor • fill out purchase orders (PO) • send PO to vendor • prepare invoice • make payment • arrange shipment • product inspection and reception
e-Business Challenges How to determine the adequate capacity of its e-business site to prevent frequent system updates ? (predictable changes) Prepared to accommodate a sudden rise in transaction volume per unit time?(unpredictable changes) Breaking news causes bursts of traffic on online newspapers Enough servers enough to handle all customers in peak hours? Can the site architecture be scaled up easily? What components should be upgraded? Database servers? Web servers? Application servers? Or network bandwidth? Trading Speed is electronic! Many changes can occur in a short period of time. 14
e-Business Challenges: QOS To avoid losing sales and customers, online companies should guarantee quality of service Quality of service (QoS) means: Fast response time High availability Certain level of security 15
Quantitative Approach Quality of service (QoS) depends on: Site architecture Network capacity System software structure 16
Reference Models for e-Business • Four-layerreference model for e-business: • Framework and basis for the quantitative approach
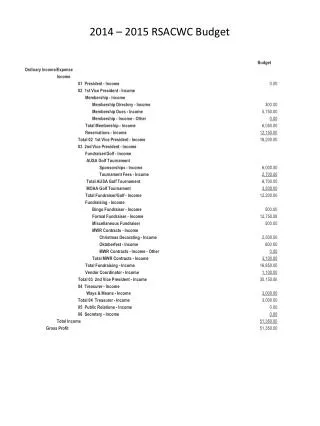
External Descriptors and Metrics • External descriptors (parameters) give a quantitative overview of the business include number of registered customers, maximum number of simultaneous customers in the store and services available to customers • External metrics(results) are used to assess the performance of the business processes. Such metrics include revenue throughput, measured in dollars/sec, page views/day and visitors/day
Internal Descriptors and Metrics • Internal metricsand descriptors characterize the site infrastructure and the way services and resources used by customers • Internal descriptors include application and architecture information, such as navigational structure, customer’s navigation patterns • Internal metrics are used to measure the performance of applications and of the IT infrastructure. Such metrics include HTTP requests/sec, transaction response time, network utilization
Business Models A business model can be defined as an architecture for product, service, and information flow, including a description of business players, their roles, and revenue sources Several e-business models include: Online retailing Online auction 20
Business Models: Examples • Content portal • gateways to the Web or to a set of Web pages addressing specific topics • Value-added services, such as consistent interface to the Web, prioritization of links, and timely information • Distribution • provide components and production supplies • Services • 24 hours a day, 7 days a week using the B2C model • Examples: travel, financial and banking industries • Publishing • Examples: Newspaper, magazines, survey reports • Revenue: by charging subscription fees or adopting advertising
Business Models: Descriptors • Customers use auctions to sell and buy items such as coins, stamps, CDs and etc. There is no charge to browse, bid on, or buy items • But sellers pay fees to list and sell items • The site is available 24 hours a day and 7 days a week • The business model of this site could be quantified by the following descriptors: • Number of item categories: 1000 • Number of auctions per day: 45,000 • Number of registered users: 1 million • Number of pages views per day: 4.8 million
Functional Models • Functional model describes the trading processes that deliver services to customers of an electronic business company • The processes are sets of interlinked activities that directly deliver business outcomes • The model can be obtained from a top-down analysis • The model provides the framework to identify the navigational structureof a site and to analyze different possible paths taken by customers
Functional Models: Navigation Structure • For example, when a customer arrives at the homepage of an auction site, the user can visit pages such as • 1) Browse, • 2) Search, • 3) Display Item Description, • 4) Bid on an item, • 5) Pay and etc
Customer Models: Navigation Pattern • The customer model captures the navigational pattern of a customer during a visit • The model can be used to derive behavior metrics such as how many times a certain function is invoked during a shopping session or the average length of a typical session
Resource Models • The performance of an e-business site depends on: • the pattern of services requested by customer, as described by the customer model (behaviour) What services are required? • The demands that each service places on the site’s resources (magnitude) How heavily are the servers used? • The number of customers arrive at the site (frequency) How often the services come? • The resource model combines these three aspects to calculate performance metricssuch asprocessor utilization and average number of requests waiting for the database service • Higher level metrics, such as customer response time or site revenue per second, can also be obtained by the resource model
Quality of Service and the Metrics • Example 1 • Consider the auction example : • Multimedia capabilities: Amazon Firephone • The load of an auction site depends on the time of day, day of the week, items for sale, and advertising campaigns. • Management wants to know to what network bandwidth increase to support the multimedia capacities during the peak hour • From the business model, number of page views per day is 4.8 million • Based on the navigational patterns, analysts identified that 3/10 page requests are “Display Item Description”
Quality of Service: Example 1 To add multimedia features, average size of the pages would increase by 90,000 bytes, What is the increase in bandwidth? AveragePageRequest/Hour = Pages perDay/24 = 4,800,000/24 = 200,000 pages/hour PeakPageRequest = AveragePageRequest x PeakLoadFactor = 200,000 x 10 = 2,000,000 pages/hour Number ofDisplayPages onPeak = PeakPageRequest x 0.3 = 2,000,000 x 0.3 = 600,000 PeakBankwidthIncrease = Number ofDisplay (PagesOnPeak) x PageSize Increase = 600,000 x 90,000 bytes/hour = 120Mbps
Quality of Service: Example 2 Consider the auction company • To achieve an availability goal of 99%, what is the maximum of number downtime (repair system components if damaged, do maintenance on the system, restart the system, etc) hours per year? • Calculation: % of Availabilitiy Per Year = (Hours Per Year – Hours Of Unavailability) / Hours Per Year 99% = (8760 – HoursOfUnavailability) / 8760 Hours Of Unavailiability = 87.6 hours
Quality of Service:Example 3 THE 8 seconds Rule Consider an online retailer, - the average number of consumers that visit the site per hour = 20,000 • During peak hour, the visitors rate is 3 times higher than the average • During peak hour, 90% of customers experience a page download time exceeding 8 seconds, become frustrated and abandon the site • 6% of the visitors purchase something and average value of a purchase is $45 • What is the lost revenue due to the poor performance? Hourly Revenue = Visitor Rate x Buying Percentage x Average Amount Of Purchase = 20,000 x 3 x 0.06 x 45 = $162,000 Lost Revenue = Hourly Revenue x Abandon Rate = 162,000 x 0.9 = $145,800
The Quantitative Approach 1 • Main steps of the quantitative approach to analyze e-business sites: It is used to establish service level goals and determine what applications are central to the goals Then go through the quantitative analysis cycle
The Quantitative Approach 2Understanding the e-business Site Architecture • What is the site configuration in terms of servers and internal connectivity? • What types of servers (i.e., HTTP, database, or authentication) are running? • What types of software (i.e., operating system, HTTP server software, transaction monitor, DBMS) are used in each server machine? • How reliable and scalableis the architecture?
The Quantitative Approach 3Measuring the Performance of the Systems • Performance measurements should be collected from different reference points. e.g. logs of transactions and accesses to servers are the main source of information • Typical questions: • What is the number of customer visits per day? • What is the site revenue for a specific period of time? • What is the average and peak traffic to the site? • What characterizes the shoppers of a particular set of products?
The Quantitative Approach 4Understanding the Customer Behavior • Different types of customers exhibit different navigational patterns and so invoke services in different ways with different frequencies • Each service may exercise the site’s resources in a different manner.
The Quantitative Approach 5Understanding the Site Workload • e-business workload are composed of sessions, sequences of requests of different types made by a single customer during a single visit • What are the demands of the browse, search, select, add to the shopping cart, user registration, and paye-functions?
The Quantitative Approach 6Developing Performance Models • Quantitative techniques and analytical models based on queuing network theory are used to evaluate the performance of e-business sites • Performance models can be used to predict performance when any aspect of the workload or the site architecture is changed
The Quantitative Approach 7Obtaining Input Parameters for Performance Models • These parameters describe the site architecture, including Web servers, application servers, and database servers and the workload under study • Each server consists of many basic components that contribute to the system performance, such as processors, disks, and network interfaces • Compute information from the models
The Quantitative Approach 8Forecasting The techniques and strategies for forecasting demand should provide answers to the following questions • What is the expected workload of the e-business website during the holiday session? • How will the number of users of an online auction vary during the next 6 months?
The Quantitative Approach 9Predicting Site Performance • Using the performance model and workload forecasts, many possible alternative architectures are analyzed to determine the most cost-effective one • The future scenarios should consider the expected workload, the site cost, and the quality of service perceived by customers