Download
1 / 1
10 likes | 70 Views
NW-PULSE @ NW BIO 2014. “I’m Picasso Until My Brush Hits the Canvas” vs. “Whatever…” Umpqua Community College. Ken Carloni, Ph.D.; Joanne Richards, D.V.M.; Jason Aase, M.S.

E N D
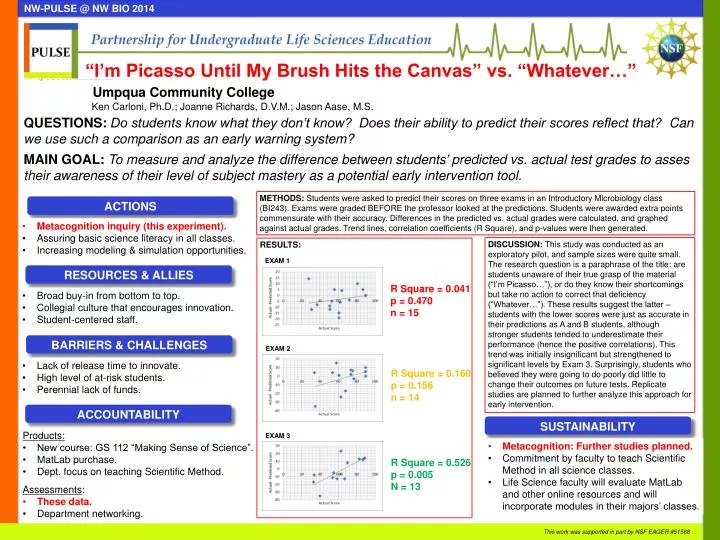
NW-PULSE @ NW BIO 2014 “I’m Picasso Until My Brush Hits the Canvas” vs. “Whatever…” Umpqua Community College Ken Carloni, Ph.D.; Joanne Richards, D.V.M.; Jason Aase, M.S. QUESTIONS: Do students know what they don’t know? Does their ability to predict their scores reflect that? Can we use such a comparison as an early warning system? MAIN GOAL: To measure and analyze the difference between students’ predicted vs. actual test grades to asses their awareness of their level of subject mastery as a potential early intervention tool. METHODS: Students were asked to predict their scores on three exams in an Introductory Microbiology class (BI243). Exams were graded BEFORE the professor looked at the predictions. Students were awarded extra points commensurate with their accuracy. Differences in the predicted vs. actual grades were calculated, and graphed against actual grades. Trend lines, correlation coefficients (R Square), and p-values were then generated. ACTIONS • Metacognition inquiry (this experiment). • Assuring basic science literacy in all classes. • Increasing modeling & simulation opportunities. DISCUSSION: This study was conducted as an exploratory pilot, and sample sizes were quite small. The research question is a paraphrase of the title: are students unaware of their true grasp of the material (“I’m Picasso…”), or do they know their shortcomings but take no action to correct that deficiency (“Whatever…”). These results suggest the latter – students with the lower scores were just as accurate in their predictions as A and B students, although stronger students tended to underestimate their performance (hence the positive correlations). This trend was initially insignificant but strengthened to significant levels by Exam 3. Surprisingly, students who believed they were going to do poorly did little to change their outcomes on future tests. Replicate studies are planned to further analyze this approach for early intervention. RESULTS: EXAM 1 RESOURCES & ALLIES R Square = 0.041 p = 0.470 n = 15 • Broad buy-in from bottom to top. • Collegial culture that encourages innovation. • Student-centered staff. BARRIERS & CHALLENGES EXAM 2 • Lack of release time to innovate. • High level of at-risk students. • Perennial lack of funds. R Square = 0.160 p = 0.156 n = 14 ACCOUNTABILITY SUSTAINABILITY • Products: • New course: GS 112 “Making Sense of Science”. • MatLab purchase. • Dept. focus on teaching Scientific Method. • Assessments: • These data. • Department networking. EXAM 3 • Metacognition: Further studies planned. • Commitment by faculty to teach Scientific Method in all science classes. • Life Science faculty will evaluate MatLab and other online resources and will incorporate modules in their majors’ classes. R Square = 0.526 p = 0.005 N = 13 This work was supported in part by NSF EAGER #51588