Download
1 / 91
920 likes | 938 Views
Chapter 21 Demand and Supply Elasticity. Did You Know That. The government predicted it would raise $6 million per year in new revenues from a new 10 percent luxury tax on private airplane and yacht sales a few years ago It actually collected only $53,000? How can that be?.

E N D
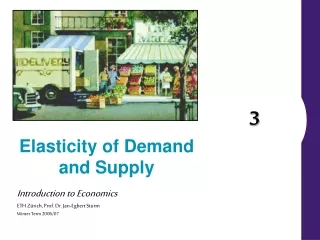
Chapter 21 Demand and Supply Elasticity
Did You Know That... • The government predicted it would raise $6 million per year in new revenues from a new 10 percent luxury tax on private airplane and yacht sales a few years ago • It actually collected only $53,000? • How can that be?
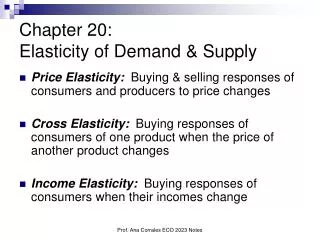
Price Elasticity • Price Elasticity of Demand (Ep) • The responsiveness of quantity demanded of a commodity to changes in its price
percentage change in quantity demanded Ep = percentage change in price %DQd Ep = %DP Price Elasticity • Price Elasticity of Demand (Ep)
-1% Ep = = -.1 +10% Price Elasticity • Example • Price of oil increases 10% • Quantity demanded decreases 1%
Price Elasticity • Question • How would you interpret an elasticity of -0.1? • Answer • A one percent increase in the price of oil will lead to a one percent decrease in quantity demanded
Price Elasticity • Relative quantities only • Elasticity is measuring the change in quantity relative to the change in price • Always negative • An increase in price decreases the quantity demanded, ceteris paribus
change in Qd % change in Qd = original Qd change in price % change in price = original price Calculating Elasticity • Calculating elasticity
1 = 100% %DP = 1 Price Elasticity • The basics of measuring percentage changes • If price increases from $1 to $2 the percent change in price is:
1 = 50% %DP = 2 Price Elasticity • The basics of measuring percentage changes • If price falls from $2 to $1 the percent change in price is:
Price Elasticity • The basics of measuring percentage changes • The percentage is influenced by the base of the original value.
change in Q change in P Ep= or sum of quantities/2 sum of Prices/2 change in Q change in P or D Q D P Ep= Ep= (Q1 + Q2)/2 Avg. Q Avg. P (P1 + P2)/2 Calculating Elasticity • Adjusting for the percent change bias
1 = .67 %DP = 3/2 Calculating Elasticity • Example • If the price increases from 1 to 2:
1 = .67 %DP = 3/2 Calculating Elasticity • Example • If the price decreases from 2 to 1:
International Example:The Price Elasticity of Demand for Newspapers • Price of Today was lowered 25 pence to 10 pence • Circulation increased from 590,000 to 1.05 million copies
D Q D P Ep= (Q1 + Q2)/2 (P1 + P2)/2 Ep= 1,050,000 - 590,000 (590,000 + 1,050,000)/2 25 - 10 (10 + 25)/2 International Example:The Price Elasticity of Demand for Newspapers
460,000 15 Ep= = .66 820,000 17.5 International Example:The Price Elasticity of Demand for Newspapers • Interpretation • A 60% decrease in price will increase quantity demanded by .66 percent.
Price Elasticity Ranges • Elastic Demand • Percentage change in quantity demanded is larger than the percentage change in price • Ep> 1
Price Elasticity Ranges • Unit Elasticity of Demand • Percentage change in quantity demanded is equal to the percentage change in price • Ep= 1
Price Elasticity Ranges • Inelastic Demand • Percentage change in quantity demanded is smaller than the percentage change in price • Ep< 1
Price Elasticity Ranges • Elastic demand %DQ > %DP; Ep > 1 • Unit elastic %DQ = %DP; Ep = 1 • Inelastic demand %DQ < %DP; Ep < 1
Real World Examples…analysis includes historic sales data, both public and private, and use of present-day surveys of customers' preferences. Data as of 3-9-2011
Airline travel (US) • -0.3 (First Class) • -0.9 (Discount) • -1.5 (for Pleasure Travelers)
Soft drinks • -0.8 to -1.0 (general) • -3.8 (Coca-Cola) • -4.4 (Mountain Dew)
Car fuel • -0.25 (Short run) • -0.64 (Long run)
Steel -0.2 to -0.3
Eggs • 0.1 (US: Household only) • 0.35 (Canada) • 0.55 (South Africa)
Live Performing Arts (Theater, etc.) • -0.4 to -0.9
Rice • 0.47 (Austria) • 0.80 (Bangladesh) • 0.80 (China) • 0.25 (Japan) • 0.55 (US)
Cinema visits (US) • -0.87 (General)
Extreme elasticities • Perfectly Inelastic Demand • A demand curve that is a vertical line • It has only one quantity demanded for each price • No matter what the price, quantity demanded does not change • There can be NO close substitutes
Perfectly Inelastic Demand Example: BUT WAIT ! Mine has treplobivium HG9
Extreme Price Elasticities Price 0 Quantity Demanded per Year(millions of units)
Extreme Price Elasticities D Perfect inelasticity, or zero elasticity Price 0 8 Quantity Demanded per Year(millions of units) Figure 20-1, Panel (a)
P1 P0 Extreme Price Elasticities D Price Perfect inelasticity, or zero elasticity 0 8 Quantity Demanded per Year(millions of units)
Price Elasticity Ranges • Extreme elasticities • Perfectly Elastic Demand • A demand curve that is a horizontal line • It has only one price for every quantity • The slightest increase in price leads to zero quantity demanded Burt’s Office Equipment Ernie’s Inc. Barry’s Office Space ($4.79 – 1,000 Pack) ($4.79 – 1,000 Pack) ($4.79 – 1,000 Pack) ($5.79 – 1,000 Pack)
Extreme Price Elasticities Price (cents) 0 Quantity Demanded per Year(millions of units)
Extreme Price Elasticities 30 D Price (cents) Perfect elasticity, or infinite elasticity 0 Quantity Demanded per Year(millions of units) Figure 20-1, Panel (b)
Extreme Price Elasticities P1never touches the demand curve P1 30 D Price (cents) Perfect elasticity, or infinite elasticity 0 Quantity Demanded per Year(millions of units)
Policy Example:Who Pays Higher Cigarette Taxes? • In recent years Congress and state legislatures have increased cigarette taxes. • These taxes are a flat amount per pack • Sellers pay the tax but supply the same quantity only at the old price plus the tax • Supply decreases • Who pays the tax depends on price elasticity of demand
Price Elasticity: A Cigarette Tax Figure 20.2, Panels (a) and (b)
Policy Example: Who Pays Higher Cigarette Taxes? Figure 20.2, Panel (c)
The Relationship Between Price Elasticity of Demand and Total Revenues for Cellular Phone Service
The Relationship Between Price Elasticity of Demand and Total Revenues for Cellular Phone Service 1.10 1.00 .90 .80 .70 .60 Price per Minute ($) .50 .40 .30 .20 .10 0 1 2 3 4 5 6 7 8 9 10 11 Quantity per period (billions of minutes)
Elastic (Ep > 1) Unit-Elastic (Ep = 1) Inelastic (Ep < 1) The Relationship Between Price Elasticity of Demand and Total Revenues for Cellular Phone Service 1.10 1.00 .90 .80 .70 Demand, or average revenue curve .60 Price per Minute ($) .50 .40 .30 .20 .10 D 0 1 2 3 4 5 6 7 8 9 10 11 Quantity per period (billions of minutes) Figure 20-3, Panel (b)
The Relationship Between Price Elasticity of Demand and Total Revenues for Cellular Phone Service 3.0 2.5 2.0 Total Revenue ($ billions) 1.5 1.0 0.5 0 1 2 3 4 5 6 7 8 9 10 11 Quantity per period (billions of minutes)
Elastic Unit-Elastic Inelastic The Relationship Between Price Elasticity of Demand and Total Revenues for Cellular Phone Service 3.0 2.5 2.0 Total Revenue ($ billions) 1.5 Total revenue curve 1.0 D 0.5 0 1 2 3 4 5 6 7 8 9 10 11 Quantity per period (billions of minutes) Figure 20-3, Panel (c)
Elasticity and Total Revenues • Elastic Demand • A negative relationship exists between small changes in price and changes in total revenue
Elasticity and Total Revenues • Unit-Elastic Demand • Changes in price do not change total revenue