Download
1 / 17
270 likes | 418 Views
Aeronautical Charts. By: Lisa Mozer. Information on Maps Topography Aeronautical information Navigational information. Aeronautical Charts. Great circle – small circle Parallels – lines of latitude 0 º = equator 90º = pole Referenced north or south of equator

E N D
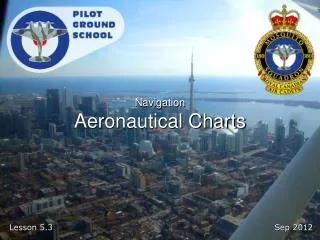
Aeronautical Charts By: Lisa Mozer
Information on Maps Topography Aeronautical information Navigational information Aeronautical Charts
Great circle – small circle Parallels – lines of latitude 0º = equator 90º = pole Referenced north or south of equator Meridians – lines of longitude 0º = line through Greenwich, England – prime meridian 180º approx = International Date Line Referenced east or west of prime meridian Longitude and Latitude
Printed on charts Each degree subdivided into 60 minutes Latitude and Longitude
Mercator, projection has distortion of land masses increases with distance from equator Lambert Conformal Conic, projection has less distortion provided large area of earth’s surface not shown Projections
Mercator Projection http://en.wikipedia.org/wiki/Mercator_projection
Covers 6º to 8º of longitude and 4º latitude Scale is 1:500,000 1 inch on sectional equals 7 nautical or 8 statute miles Contour lines Cities, towns, rivers, highways, railroads Distinctive landmarks Aeronautical information Navigation, communications, airspace, obstructions Revised every 6 months Sectional Charts
Scale 1:1,000,000 1 inch equals 14 nautical or 16 statute miles Some detail omitted due to smaller scale Revised yearly World Aeronautical Charts (WAC)
Legend Airport symbols Airport data Navigation aids (Navaids) Topographical info Symbols not on chart legend Obstructions Symbols
The Flight Environment Section D Airspace
Controlled Airspace Transponder with Mode C required in Class A Class B Within 30 nautical miles of Class B airport Class C Airspace
Special charts for flying VFR around Class B airspace Larger scale, 1:250,000 – more detail White border on sectional chart shows availability May have VFR flyways, VFR corridors, VFR transition routes on reverse VFR Terminal Area Charts
Where Class B, C, D or E airspace extends to surface around airport, VFR minimums are at least 3 sm. and 1000’ AGL SVFR clearance allows ops in these areas with at least 1 sm. and clear of clouds Private pilot – only daytime At night – must be instrument rated and ac equipped for instrument flight Some airports – NO SVFR Special VFR
Below 10,000’ MSL – max 250 knots In Class C or D, below 2,500’ within 4 nm of primary airport – max 200 knots Underlying Class B and VFR corridors through Class B – max 200 knots Speed Limits
Alert areas Military operations areas Warning areas Restricted areas Prohibited areas Controlled firing areas National security areas Special Use Airspace