Download
1 / 36
360 likes | 367 Views
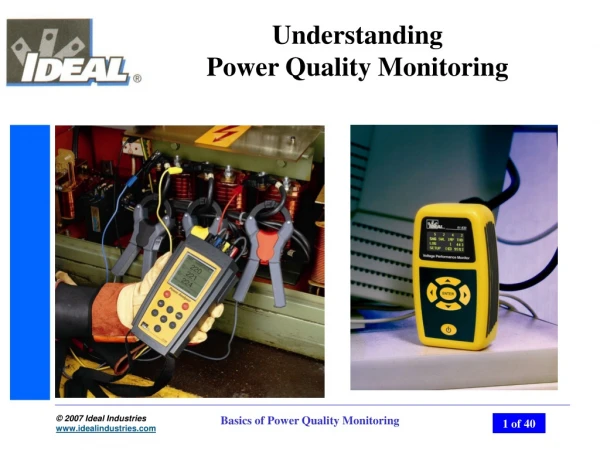
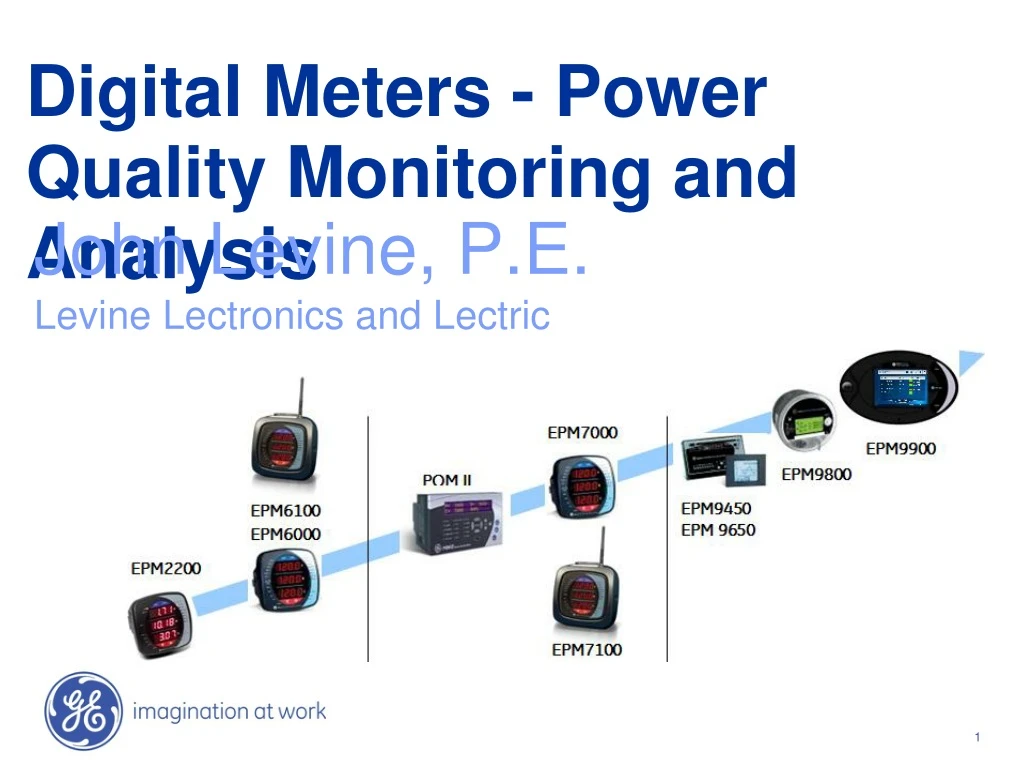
Digital Meters - Power Quality Monitoring and Analysis. John Levine, P.E. Levine Lectronics and Lectric. Contents. Effects of power quality Power Quality definitions revisited What is needed for PQ monitoring ? Summary. Monitor and Analyze Power Disturbances, Disruptions & Harmonics.

E N D
Digital Meters - Power Quality Monitoring and Analysis John Levine, P.E. Levine Lectronics and Lectric
Contents • Effects of power quality • Power Quality definitions revisited • What is needed for PQ monitoring ? • Summary Monitor and Analyze Power Disturbances, Disruptions & Harmonics
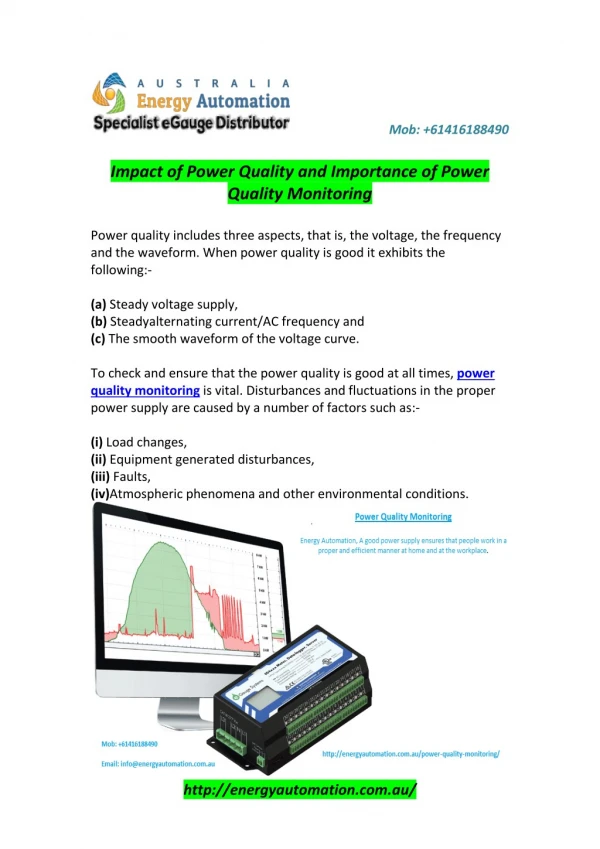
PQ is a Business Problem • Power Quality issues cause business problems such as: • Lost productivity, idle people and equipment • Lost orders, good will, customers and profits • Lost transactions and orders not being processed • Revenue and accounting problems • Customer and/or management dissatisfaction • Overtime required to make up for lost work time According to Electric Light and Power Magazine, 30 to 40 Percent of All Business Downtime Is Related to Power Quality Problems.
Why PQ is such a Big Problem? • The sensitivity of today’s electronic equipment makes it susceptible to power disturbances • For some devices, a momentary disturbance can cause • scrambled data • interrupted communications • a frozen mouse • system crashes and equipment failure
PQ Problems are Expensive • Berkeley Lab Study Estimates $80 Billion Annual Cost of Power Interruptions … Research News, Berkeley Lab, February 2, 2005 • $50 billon per year in the USA is lost as a results of power quality breakdowns …. Bank of America Report • A manufacturing company lost more than $3 million one day last summer in Silicon Valley when the “lights went out.” … New York Times January 2000 • “A voltage sag in a paper mill can waste a whole day of production - $250,000 loss” … Business Week, June 17,, 1996 • Half of all computer problems and one-third of all data loss can be traced back to the power line … Contingency Planning Research, LAN Times
Who is Affected? • High Cost Facilities • Semiconductor plants • Pharmaceuticals • Data centers • Lost production • Scrap • Costs to restart • Labor costs • Equipment damage and repair • Other costs • MediumCost Facilities • Automotive manufacturing • Glass plants • Plastics & Chemicals • Textiles
PQ Definitions Revisited For Electric Utilities Control of Voltage and Prevention of Outages is Power Quality
Sources of PQ Problems • Internal Sources • Individual Loads –Lighting, Elevators, Coolers, HVAC • Uninterruptible Power Supplies • Variable Frequency Drives • Battery Chargers • Large Motors During Startup • Electronic Dimming Systems • Lighting Ballasts (esp. Electronic) • Arc Welders, and Other Arc Devices • Medical Equipment, e.g. MRIs and X-Ray Machines • Office Equipment and Computers • Wiring • Utility Sources • Lightning • PF Correction Equipment • Faults • Switching
Outages, 6% Spikes, 7% Swells, Sags, 56% 31% Source: EPRI, 1994 Major PQ Problems Swells System fault conditions Switching on a large capacitor bank Switching off a large load Sags (Dips) Associated with system faults Switching of heavy loads Starting of large motors
Textile Industry Plastics Industry Glass Industry Process Industry Semiconductors $1k $10k $100k $1M $10M Source: EPRI “The Economics of Custom Power”, IEEE T&D Show 2003 Losses per Voltage Sag Event Cost of Voltage Sags
Momentary Outages create problems when computers and clocks reset, equipment stalls, and work stops. Cost of Momentary Outages
High Speed Waveform Capture High Speed Waveform Capture Is the Most Important PQ Troubleshooting Tool
It provides data to see, diagnose and avert looming problems – “like squeaky brakes on a car” • Trends can be detected • JIT equipment maintenance programs can be established • It acts like a “Black Box” on an airplane to tell you what, when, and where a Power Quality event occurred … to prevent it from reoccurring Benefits of Continuous PQ Monitoring • Power Quality monitoring provides a continuous “Health Check” of a facility’s power system … for example: • Harmonic interaction between loads and power conditioning equipment spotted • High Inrush currents from equipment startup detected • Transients from load switching are seen ContinuousPQ Monitoring Detects, Records, and Leads to the Prevention of PQ Problems
What is needed for PQ Monitoring? • Plus they must … • Be easy to use • Be Suitable for continuously monitoring indoors and outdoors • Interface with standard PQ analysis Software…PQDif format • Be fast enough to capture high speed events that produce equipment problems • Have enough storage to save the waveforms you need • Have PQ analysis tools that produce usable, actionable recommendations • PQ Monitors must detect and record the 7 types of PQ problems • Transients • Interruptions • Sag/Under Voltage • Swell/Over Voltage • Waveform Distortion • Voltage Fluctuations • Frequency Variations • These include Flicker and Compliance to ITI(CBEMA), IEEE and ISO Standards ITI: Information Technology Industry Council (Computer & Business Equipment Manufacturer’s Association)
Real Time Field Recorded Events Source: AGA Brazil Meter: EPM9650 Period: Jan 2005 – Dec 2005 Continuous Monitoring of the Station for PQ Problems
PQ Meter ITI Capture ITI Acceptable Power Disturbance Envelope Damage Inducing Voltage Surges as Recorded Equipment Interrupting Voltage Sags as Recorded ITI: Information Technology Industry Council (Computer & Business Equipment Manufacturer’s Association)
Accurate Measurement to determine actual state Examinations High resolution recordings for longer durations GE Communicator software Diagnosis Remedial actions Remedy Summary • GE Multilin provides the necessary tools for a successful PQ disturbance analysis and allows users to take remedial actions Symptoms Feels the pulse of the power system network
Finally… If You Can’t Measure it You Can’t Manage it If You Can Measure it You Can Manage it