Download
1 / 29
290 likes | 299 Views
Activity Cycles in Stars. Dr. David H. Hathaway NASA Marshall Space Flight Center National Space Science and Technology Center. Outline. The Sun’s Activity Cycle Dynamo Processes for Activity Cycles Detecting Activity Cycles in Stars Making Sense of Activity Cycles in Stars Conclusions.

E N D
Activity Cycles in Stars Dr. David H. Hathaway NASA Marshall Space Flight Center National Space Science and Technology Center
Outline • The Sun’s Activity Cycle • Dynamo Processes for Activity Cycles • Detecting Activity Cycles in Stars • Making Sense of Activity Cycles in Stars • Conclusions
The “11-year” Sunspot Cycle The sunspot cycle has had an average period of about 11 years since Cycle 1 which began in 1755. Amplitudes ( in terms of the average daily sunspot number) range from ~50 to ~200.
The Maunder Minimum The Sun went through a period of 70 years (the Maunder Minimum - 1645 to 1715) with virtually no spots. The existence of the Maunder Minimum is now well established by the efforts of Hoyt and Schatten. They have tabulated daily observations with nearly complete coverage over the period of the Maunder Minimum .
Sunspot Latitudes Sunspots appear in two bands on either side of the equator. These bands spread in latitude and migrate toward the equator as each cycle progresses. Cycles overlap at the time of minimum. The hemispheres can be asymmetric but are basically synchronized. Sunspots are rarely seen poleward of about 40°.
Sunspot Area 10.7cm Radio Flux GOES X-Ray Flares Climax Cosmic-Ray Flux Total Irradiance Geomagnetic aa index Sunspots and Solar Activity Sunspot number is well correlated with other measures of solar activity. The 400-year length of the sunspot number record helps to characterize the solar cycle. The connection with cosmic rays leaves even longer records of solar activity in tree rings (14C) and ice cores (10Be).
The Solar Interior The 11-year time-scale for the solar cycle is too short to be attributed to relic fields. Flows within the convection zone are thought to be the source of the solar cycle. Several aspects of convection zone and magnetic flux tube dynamics indicate that the interface layer or “tachocline” is the seat of the solar cycle.
Internal Rotation Rate Helioseismic determinations of the internal rotation rate show that the latitudinal differential rotation seen at the surface extends through the convection zone. Layers of strong radial shear are found near the surface and at the base of the convection zone (the tachocline).
The Basic Dynamo Processes Differential rotation amplifies the poloidal field by wrapping it around the Sun to produce a strong toroidal field. Lifting and twisting the toroidal field can produce a poloidal field with the opposite orientation. The Ω-effect The α-effect
Cycle Periods Many models of the Sun’s magnetic dynamo make use of the meridional circulation. In these models the period of the cycle is inversely related to the flow velocity at the base of the convection zone. In other models the period is inversely related to √∆Ωα. In/CCW Out/CW Dikpati & Charbonneau (1999)
Wilson’s Studies at Mt. Wilson Starting in 1966 Olin Wilson used the 100-inch telescope on Mt. Wilson to examine the emission in the cores of the Ca II H and K lines in 91 main sequence stars from M2 to F5. This emission is well correlated with the presence of magnetic fields on the Sun. The Sun in Ca II K The Sun’s Magnetic Field Spectral bands in Ca II H & K
Ca II and the Sunspot Cycle Viewing the Sun as a star in Ca II K over a sunspot cycle shows a strong correlation between Ca II K emission and sunspot number. Baliunas & Soon (1995)
Ca II Variations in Stars These observation yield information on the level of activity and its variability – both short term (rotation) and long term (stellar cycles). Dobson et al. (1990)
Activity Cycles on Other Stars Wilson’s work has been extended by others (e.g. Vaughn, Preston, Baliunas and Radick) and we now have information about activity cycles in many stars. Cycle amplitudes and periods show considerable variation from star-to-star. Radick (2000)
Cycle Characteristics Baliunas et al. (1995) found cycle periods from 2 years to more than 20. The more active stars tended to be faster rotating and have more chaotic activity. The least active stars tended to be rotating slowly an often didn’t show cyclic behavior. Note: these are stars of different ages and spectral types. V – Variable C – Cyclic L – Long term F - Flat
p-p Chain Convection Zones The lowest mass stars are full convective. Stars like the Sun have outer convection zone. More massive stars have inner convection zones. The transition between envelope and core convection is at M ~1.3 M - at least theoretically. CNO Cycle
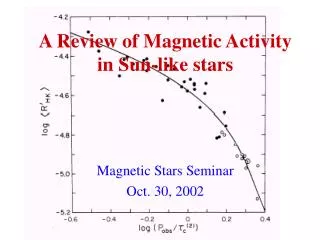
Cycle Period vs. Rossby Number Noyes, Weiss, & Vaughn (1984) showed that the Rossby Number - the ratio of a convective turnover time to the rotation period – was a good predictor of cycle periods. Shorter rotation rates relative to the convective turnover time corresponded with shorter cycles.
Activity vs. Rossby Number The scatter plot of activity level vs spectral color falls into place when activity level is plotted against Rossby Number. Young stars (filled dots) are more active than old stars (open circles). Fast rotating stars are more active than slow ones.
Convection in Solar Type Stars Numerical models for convection in solar type stars show how differential rotation is produced by the effects of rotation on the convective flows. Cells stretched north to south are key. Brown et al. 2007
Dynamic Variations in Solar Type Stars As rotation increases from the Sun’s rate differential rotation first increases and then decreases with further increase in rotation rate. Faster rotation rate gives slower meridional flow. Brown et al. 2007 If the cycle period is set by the meridional flow speed then faster rotating stars should have longer, not shorter periods according to this model.
Doppler Imaging Spectral lines from rotating stars are broadened by the area & intensity weighted fraction of the stellar surface at different Doppler velocities. The presence of a starspot leaves a bump in the spectral line that moves from the blue to the red as the spot rotates across the disk.
Doppler Images Doppler imaging gives information on sizes and latitudes of starspots. Some observations indicate large polar spots - which raise more questions. Are they produced by strong meridional flows? Are they produced by poleward moving dynamo waves? AG Dor HU Vir
Conclusions • Young stars (< 1 Gyr) have high levels of activity, rapid rotation, and chaotic variations • Intermediate age stars have moderate levels of activity and rotation rate and have smooth cycles • Stars as old as the Sun have low levels of activity, slower rotation, some periods of inactivity (Maunder Minima) • Changes in differential rotation and meridional flow speed with rotation rate in numerical models favors activity cycle periods set by α and ∆Ω.