Download
1 / 100
1k likes | 1.01k Views
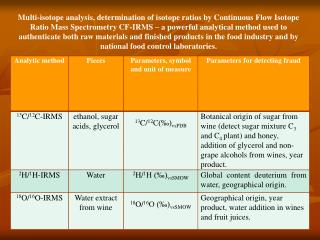
Training in Stable Isotope Methods, Mass Spectrometery & Isotopology. IB 400 Todd Dawson (2-6090) tdawson@berkeley.edu Paul Brooks (3-1748) isotopes@berkeley.edu Kevin Simonin (2-1054) ksimonin@berkeley.edu. & Elizabeth Wenk for all her powerpoint magic. 9-28-05 Version.

E N D
Training in Stable Isotope Methods, Mass Spectrometery & Isotopology IB 400 Todd Dawson (2-6090) tdawson@berkeley.edu Paul Brooks (3-1748) isotopes@berkeley.edu Kevin Simonin (2-1054) ksimonin@berkeley.edu & Elizabeth Wenk for all her powerpoint magic 9-28-05 Version
Training in Stable Isotope Methods, Mass Spectrometery & Isotopology Goal: provide some of the fundamentals needed to understand isotopes and their use in the biological sciences Six sessions: Fundamentals of isotope physics & chemistry Case studies of how stable isotopes have been applied in natural systems Sampling issues: what, where, how and help! of isotope sample collection and preparation The isotope ratio mass spectrometer: how it works and how you make it work for your research 5. Correcting your data - tour de Excel! 6. Discussion about isotope applications & your work - the questions you face and the challenges you need to resolve » Introductions: who you are, what you do, why isotopes?
TODAY:Introduction to Stable Isotopes 1. Introduction to isotopes 2. Isotopes used in ecological studies 3. Stable isotope notation 4. Correct usage of stable isotope expressions 5. Causes of variation in stable isotope abundances 6. Fractionation factors 7. Rayleigh distillation: using fractionation factors
Why use stable isotopes? » They are non-radioactive TRACERS of resource origin, fate and flux including: organismal movements energy or resource flow across levels of ecological organization » They are non-destructive and non-disruptive INTEGRATORS of ‘system’ processes including: 1. organismal function/tradeoffs 2. spatial and temporal responses to environment
History of Isotopy: • 1914 Fredrick Soddy proposed that any place on periodic table can be occupied by more than one kind of atom • He proposed isotope---- meaning “same place” • Isotopes Nuclides of single element having different atomic weights • Presently more than 2500 nuclides are known from ~110 elements
These entities are of greatest interest to us Nuclear Entities
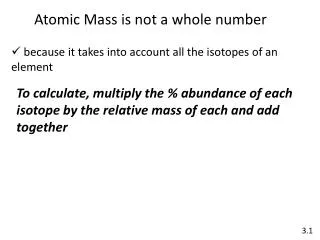
Atoms First: An atom is composed of three types of particles: PROTONS, NEUTRONS, and ELECTRONS Each element has a unique number of protons, its atomic number. The number of protons (Z) determines many of the chemical and physical properties associated with an atom. The atomic mass is the sum of protons and neutrons (N), particles with nearly identical weights. (Electrons, negatively charged particles, have insignificant weight – to ecologists!) The atomic number = Z (Protons) The atomic mass = Z + N (Protons + Neutrons)
Partial chart of the elements Each square represents a nuclide, an isotope specific atom Atomic number = Z (Protons): bottom left of each atom Atomic mass = Z + N (Protons + Neutrons): top left of each atom 8 7 6 5 4 3 2 1 13 8 14 8 15 8 16 8 17 8 18 8 19 8 20 8 12 7 13 7 14 7 15 7 16 7 17 7 18 7 9 6 10 6 11 6 12 6 13 6 14 6 15 6 16 6 8 5 9 5 10 5 11 5 12 5 13 4 Proton Number (Z) 6 4 7 4 8 4 9 4 10 4 11 4 12 4 5 3 6 3 7 3 8 3 9 3 3 2 4 2 5 2 6 2 8 2 1 1 2 1 3 1 0 1 2 3 4 5 6 7 8 9 10 11 12 13 Neutron Number (N)
Partial chart of the elements isotopes Each green row represents nuclides that are isotopes: they share a common number of protons (Z) but differ in their number of neutrons (N). 8 7 6 5 4 3 2 1 13 8 14 8 15 8 16 8 17 8 18 8 19 8 20 8 12 7 13 7 14 7 15 7 16 7 17 7 18 7 9 6 10 6 11 6 12 6 13 6 14 6 15 6 16 6 8 5 9 5 10 5 11 5 12 5 13 4 Proton Number (Z) 6 4 7 4 8 4 9 4 10 4 11 4 12 4 5 3 6 3 7 3 8 3 9 3 3 2 4 2 5 2 6 2 8 2 1 1 2 1 3 1 0 1 2 3 4 5 6 7 8 9 10 11 12 13 Neutron Number (N)
Partial chart of the elements isobars Each green row represents nuclides that are isobars: they share a common atomic weight (N + Z). 8 7 6 5 4 3 2 1 13 8 14 8 15 8 16 8 17 8 18 8 19 8 20 8 12 7 13 7 14 7 15 7 16 7 17 7 18 7 9 6 10 6 11 6 12 6 13 6 14 6 15 6 16 6 8 5 9 5 10 5 11 5 12 5 13 4 Proton Number (Z) 6 4 7 4 8 4 9 4 10 4 11 4 12 4 5 3 6 3 7 3 8 3 9 3 3 2 4 2 5 2 6 2 8 2 1 1 2 1 3 1 0 1 2 3 4 5 6 7 8 9 10 11 12 13 Neutron Number (N)
Partial chart of the elements isotones Each green row represents nuclides that are isotones: they share a common number of neutrons (N). 8 7 6 5 4 3 2 1 13 8 14 8 15 8 16 8 17 8 18 8 19 8 20 8 12 7 13 7 14 7 15 7 16 7 17 7 18 7 9 6 10 6 11 6 12 6 13 6 14 6 15 6 16 6 8 5 9 5 10 5 11 5 12 5 13 4 Proton Number (Z) 6 4 7 4 8 4 9 4 10 4 11 4 12 4 5 3 6 3 7 3 8 3 9 3 3 2 4 2 5 2 6 2 8 2 1 1 2 1 3 1 0 1 2 3 4 5 6 7 8 9 10 11 12 13 Neutron Number (N)
Partial chart of the elements -decay occurs along the line of isobars The shaded squares are stable and the un-shaded squares are unstable or radioactive nuclides. 8 7 6 5 4 3 2 1 13 8 14 8 15 8 16 8 17 8 18 8 19 8 20 8 12 7 13 7 14 7 15 7 16 7 17 7 18 7 9 6 10 6 11 6 12 6 13 6 14 6 15 6 16 6 8 5 9 5 10 5 11 5 12 5 13 4 Proton Number (Z) 6 4 7 4 8 4 9 4 10 4 11 4 12 4 5 3 6 3 7 3 8 3 9 3 3 2 4 2 5 2 6 2 8 2 1 1 2 1 3 1 0 1 2 3 4 5 6 7 8 9 10 11 12 13 Neutron Number (N)
Stable isotope trends O H N C 3 important points: 1. Stable isotopes tend to have an N/Z near 1 for masses less than 20 2. Stable isotopes tend to have an even Z-number for masses greater than 20 N N/Z = 1 3. Most biologically important elements have masses less than 20 Z
Average terrestrial abundances of the stable isotopes of elements used commonly (), occasionally (), and rarely () in ecological studies
Common isotopes The 10 most common isotopes in the solar system are: H >> 4He >> 16O > 12C >> 20Ne > 14N > 24Mg > 28Si > 56Fe > 32S The isotopes we study occur throughout the solar system and are important in lots of processes! When we see this list of isotopes used in ecological studies, note that it includes many of the most common isotopes in the solar system:
Terrestrial range Technical Precision HEAVIER ISOTOPES ARE RARE!
Terrestrial range Technical Precision HYDROGEN HAS THE LARGEST MASS DIFF BETWEEN ISTOPES
Terrestrial range Technical Precision We analyze gases that contain the isotopes of interest!
Terrestrial range Technical Precision HYDROGEN HAS A LARGE TERRESTRIAL RANGE, BUT ALSO RELATIVELY LOW PRECISION NITROGEN HAS A SMALLER TERRESTRIAL RANGE, BUT BETTER TECHNICAL PRECISION
1.0860% 13C 1.0805% 13C Absolute isotope abundances are found at the third decimal leading to small relative differences Are these relevant?
Stable isotope composition is expressed in d (delta) notation: dR in ‰ = Rsample –1 x 1000 Rstandard
R is the isotope ratio of the HEAVY / LIGHT isotopes in either your sample or a standard i.e. D/H, 13C/12C , 15N/14N , 18O/16O and is a very small number Stable isotope composition is expressed in d (delta) notation: dR in ‰ = Rsample –1 x 1000 Rstandard
Delta notation indicates the isotope ratio in your sample relative to a standard. If the isotope ratio in your sample equals the standard, Rsample/Rstandard = 1 and dR = 0‰ The International Atomic Energy Association (IAEA) maintains a set of standards used for stable isotope measurements. Stable isotope composition is expressed in d (delta) notation: dR in ‰ = Rsample –1 x 1000 Rstandard
Because Rsample never deviates much from Rstandard (natural variation in isotope ratios is limited), [(Rsample /Rstandard)-1] is a small number. In order to make the variation more apparent, one multiplies the value by 1000, thereby expressing the value in per mil (parts per thousand ; ‰) notation Stable isotope composition is expressed in d (delta) notation: dR in ‰ = Rsample –1 x 1000 Rstandard
The isotope abundance ratios measured and their internationally accepted reference standards
The isotope abundance ratios measured and their internationally accepted reference standards
The isotope abundance ratios measured and their internationally accepted reference standards These values are the ratios of atoms in the standards and reflect the very low abundance of the heavier isotope
Standards Some other international standards of known d value: Standard Light Antarctic Precipitation (SLAP) with values: dD = -428‰d18O = -55.5‰ Greenland Icesheet Precipitation (GISP) with values: dD = -189.7‰d18O = -24.8‰
Working standards The internationally accepted reference standards are obviously in limited supply, expensive, and cannot be used as the daily reference standard in labs around the world. Instead isotope labs employ WORKING STANDARDS. • Working standards are: used on a regular (daily) basis homogeneous well matched to your analyses easily obtained or made easily corrected back to the international standards
delta notation Those same two leaves have more interpretable isotope “values” in delta notation. 1.0860% 13C = d13C -23‰ 1.0805% 13C = d13C -28‰
delta notation • A quick note, to be elaborated on in lecture 5: • You can’t do chemical calculations with d units. • They are just for comparative purposes. • That said, for small ranges of d units “you are allowed” to be sloppy.
Atom % notation Xheavy Xheavy Xheavy + XlightXtotal Where X is the FRACTION of the heavy or light isotope in a mixture. Atom % = •100 = •100 Unlike delta notation, atom % notation does not accentuate small changes in isotope abundance. You will NOT see this notation used in the NATURAL ABUNDANCE stable isotope literature You WILL see this notation used if you are working with ENRICHED stable isotope methods
Some comparative terms: LIGHT vs. HEAVY SAMPLES DEPLETED vs. ENRICHED SAMPLES a LIGHTER sample contains more of the lighter isotope, relative to another sample a HEAVIER samples contains more of the heavier isotope, relative to another sample a sample “DEPLETED” IN THE HEAVY ISOTOPE contains less of the heavy isotope and more of the light isotope, relative to another sample a sample “ENRICHED” IN THE LIGHT ISOTOPE contains more of the light isotope and less of the heavy isotope, relative to another sample
such values are found in warm climates, at low elevation and low latitudes, evaporated water such values are found in cold climates, at high elevation and high latitudes Using the dD signature in H2O as an example: 0 • isotopically heavier • enriched in D (2H) • depleted in H dD (‰) -200 • isotopically lighter • depleted in D (2H) • enriched in H -400
Isotope Effects Urey’s Axiom: “The heavy isotopes concentrate in the compound in which the element is most strongly held” If Urey is correct then this implies that issues such as: Bond-strength, Mass of an element, isotope or atom, Rates of a chemical reaction (chemical behavior), System properties (open vs. closed), Etc. ……. Could all have effects on isotope distributions in the materials we measure and help explain the variation in stable isotope composition (e.g., variation in d).
Key points about isotopes • 1. Chemical properties of any element are largely determined by the number and configuration of electrons (e-) • Since isotopes have the same number and configuration of electrons . . . . . isotopes have the same chemical properties 13CO2 is chemically identical to 12CO2
Key points about isotopes • 1. isotopes have the same chemical properties • 2. However, isotopes differ in then number of neutrons, N they possess, and therefore in mass How do mass differences lead to variation is isotope abundance? Mass differences influence chemical BEHAVIOR in reactions or mixtures
Isotope mass effects 2. The PHYSIO-CHEMICAL properties of molecules composed of different isotopes That is, factors including vapor pressure, boiling temperature, freezing point, and melting point are affected by the isotope composition of a molecule. Differences in mass influence: 1. The RATES at which the isotopes react Lighter isotopes react faster. Therefore different isotopes involved in a chemical reaction display differential representation in different phases of the reaction • As we’ll see next, for water composed of different isotopes this has a large, measurable, and significant influence.
Physio-chemical differences Characteristic physical properties of H216O, D216O, H218O(from Hoefs 1973, 1997)
Physio-chemical differences Characteristic physical properties of H216O, D216O, H218O(from Hoefs 1973, 1997)
Physio-chemical differences DISSOCIATED ATOMS Potential energy H-H ZERO POINT ENERGY LEVELS (ZPEs) D-D ABSOLUTE ZERO Interatomic distance Isotope effect associated with zero-point energy {Morse Potential Curve} Differences in ZPEs are the fundamental cause of equilibrium isotope fractionation
Physio-chemical differences DISSOCIATED ATOMS EL = 103.2 Potential energy EH = 105.3 H-H D-D Interatomic distance Isotope effect associated with zero-point energy THESE VALUES ARE THE AMOUNT OF ENERGY REQUIRED TO BREAK THE BOND; MORE ENERGY IS NEEDED TO BREAK THE D-D BOND THAN THE H-H BOND, LEADING TO ISOTOPE EFFECTS
Physio-chemical differences In summary: Higher vibrational frequency, the stretching and compressing of chemical bonds between atoms, leads to a higher zero point energy and lower stability Bond strengths are proportional to isotope mass, so an isotope with a higher mass has a higher bond strength • Molecules with heavier isotopes will be more stable than light isotopes but diffuse more slowly Therefore, partial vaporization of a liquid pool will lead to increased concentration of the lighter isotope in the vapor phase
Reaction rate differences Differences in mass also influence theRATESat which the isotopes react The lighter isotope reacts at a faster rate,leading to a heavier d value in the remaining substrate relative to the product. -- Therefore, differences in MASS influence RATESand lead to ISOTOPE FRACTIONATION