Download
1 / 48
480 likes | 636 Views
Spatial Analysis of News Sources. Stony Brook University www.textmap.com. Andrew Mehler, Steven Skiena, Yunfan Bao, Xin Li, Yue Wang. Computational News Analysis. Lydia: Large scale newspaper analysis. Obtain data on how the volume of news coverage varies by location.

E N D
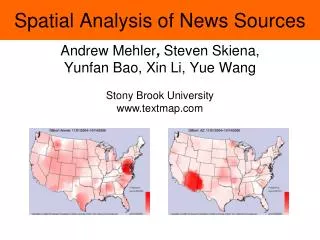
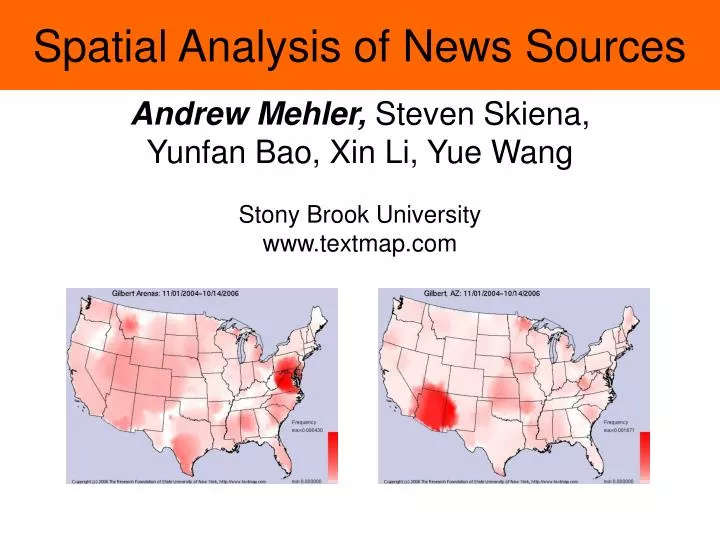
Spatial Analysis of News Sources Stony Brook University www.textmap.com Andrew Mehler, Steven Skiena, Yunfan Bao, Xin Li, Yue Wang
Computational News Analysis • Lydia: Large scale newspaper analysis. • Obtain data on how the volume of news coverage varies by location. • Our paper describes how we calculate, display, and evaluate spatial bias in news sources.
Who Is Running For President? Stony Brook University
Lydia (textmap.com) Data-maps are a component of the Lydia system. The data generated from the Lydia system drives the data-map creation. Monitors ~1000 newspapers every day and also other sources. Components of Lydia include….
Named Entity Recognition Saddam Hussein’s chief lawyer warned Sunday of worsening violence in Iraq and chaos across the Mideast if the ex-president is sentenced to death at his trial for a crackdown on a Shiite Muslim village in the 1980s. Khalil al-Dulaimi also said he would break a month long boycott and attend proceedings Monday when Saddam's second trial resumes on separate charges of genocide against the Kurds.
Segmentation and Classification Saddam Hussein’s chief lawyer warned Sunday of worsening violence in Iraq and chaos across the Mideast if the ex-president is sentenced to death at his trial for a crackdown on a Shiite Muslim village in the 1980s. Khalil al-Dulaimi also said he would break a month long boycott and attend proceedings Monday when Saddam's second trial resumes on separate charges of genocide against the Kurds.
Related Work • Visualizing Data (Tufte) • Geographic Visualization (Slocum, McMaster, Kessler, Howard) • Data Maps / Color Schemes (Brewer) • Quantitative Geography (Fotheringham, Brunsdon, Charlton) • Spatial Data-Mining (Miller, Han) • Spatial Interpolation / Smoothing (Fuentes, Stein)
Outline of this Talk News/Data Acquisition Source-Influence Modeling Spatial Visualization Identification of Spatially Biased Maps Conclusions
News Acquisition Spiders - Programs that crawl a web domain and download all of the pages. Universal Spider built using wget. Still need customization • Cookies / Logins • Page Structure / formatting / Advertisements • Each paper ~ 40-130MB in 20-80 minutes. • ~800 U.S. papers and ~300 foreign papers. Duplicate Articles? • Syndication, Persistence, Ongoing Stories
Duplicate Detection Despite playing without three injured defensive starters and losing another early, the Giants held Tampa Bay to 174 total yards and set up a score with a turnover deep in Buccaneers' territory in a 17-3 victory Sunday that gave New York its fourth straight win. Despite playing without three injured defensive starters and losing another early, the Giants held Tampa Bay to 174 total yards and set up a score with a turnover deep in Buccaneers' territory in a 17-3 victory Sunday.
Character Windows Despite playing without three injured defensive starters and losing another early, the Giants held Tampa Bay to 174 total yards and set up a score with a turnover deep in Buccaneers' territory in a 17-3 victory Sunday that gave New York its fourth straight win. Despite playing without three injured defensive starters and losing another early, the Giants held Tampa Bay to 174 total yards and set up a score with a turnover deep in Buccaneers' territory in a 17-3 victory Sunday.
Most Windows Equal in Duplicates Despite playing without three injured defensive starters and losing another early, the Giants held Tampa Bay to 174 total yards and set up a score with a turnover deep in Buccaneers' territory in a 17-3 victory Sunday that gave New York its fourth straight win. Despite playing without three injured defensive starters and losing another early, the Giants held Tampa Bay to 174 total yards and set up a score with a turnover deep in Buccaneers' territory in a 17-3 victory Sunday.
Hash Codes For Windows Document 1: 17, 29, 113, 30, 25, 10, 130, 128, 50, 119, 190, 1979 Document 2: 17, 29, 113, 30, 25, 10, 130, 128, 50
Size Reduction Document 1: 17, 29, 113, 30, 25, 10, 130, 128, 50, 119, 190, 1979 Document 2: 17, 29, 113, 30, 25, 10, 130, 128, 50
Size Reduction Document 1: 17, 29, 113, 30, 25, 10, 130, 128, 50, 119, 190, 1979 Document 2: 17, 29, 113, 30, 25, 10, 130, 128, 50
Outline of this Talk News/Data Acquisition Source-Influence Modeling Spatial Visualization Identification of Spatially Biased Maps Conclusions
Combining News Influence • How do we combine all the newspapers that are read in an area? • In Bloomsburg, PA people might read • The New York Times • The Philadelphia Inquirer • The Bloomsburg Press Enterprise • What Is Reflective of Bloomsburg’s Interests?
Linear Decay Model NY Times Bloomsburg Philadelphia
Influence Model To estimate the contributions of different sources, we develop an influence model. The influence is a function on cities and sources, quantifying how influential a source is in a particular city. Influence(New York Times, Baltimore) = ? The frequency of reference estimate for a city is then a weighted average over the sources. F(Knicks, NY) = ∑F(Knicks,s)*influence(s,NY) / ∑influence(s,NY)
Readership Estimate • The readership of a paper is estimated by combining the papers circulation with its alexa.com rpm (reach per million). • We can then estimate the radius of a newspapers influence by making 10% of the population covered equal the readership. • The influence function decays linearly with distance from the source, and 0 outside its radius of influence. • Big papers have a larger influence than small papers. • Potential readership base not a factor. • Is linear decay the right model? • Some large papers have national distributions.
Outline of this Talk News/Data Acquisition Source-Influence Modeling Spatial Visualization Identification of Spatially Biased Maps Conclusions
Representing United States Surface Triangle (Shewchuk) used to create a Delauney triangulation of the cities. • Interpolating Surface from Point Data (cities) Visualization Issues
Visualization Mesa/openGl used to render maps. Relative color scale, max heat hottest red.
Absolute Color Scale 2 maps directly comparable
Outline of this Talk News/Data Acquisition Source-Influence Modeling Spatial Visualization Identification of Spatially Biased Maps Conclusions
Which Maps are Interesting? How can we Identify the Terms With A Geographic Bias? Don’t want to look through all 200,000 entities! How do we Quantify Geographic Bias?
Variance Analysis • Our Analysis Gives frequency estimates for 25,374 cities. • We defined 2 measures based on variance. • Variance: The variance of the 25,374 values. • Weighted Variance: The variance divided by the mean. Var: 6.24e-07 W-Var: 3.00e-03 Var: 7.06e-09 W-Var: 7.11e-05 Can’t distinguish a bipolar map from a checkerboard map.
Component Analysis Consider what happens to the number of connected components if you only consider cities above a certain value.
Component Analysis Consider what happens to the number of connected components if you only consider cities above a certain value.
Component Analysis Consider what happens to the number of connected components if you only consider cities above a certain value.
Component Analysis In a biased map, we expect the largest values to be clustered together.
Component Analysis In an unbiased map, we expect many random clusters of high heat. Not the single cluster we expect in biased maps.
Component Measures • Largest Gap: The value of the largest gap. A large gap suggests the entity is drawn from 2 different distributions, local and national. • Weighted Gap: Largest divided by max. • Percentage Gap: Percentage Change.
Evaluating Bias Measures To evaluate the measures, we made 4 sets of data maps…
Results Data Set Size 400 biased 128 unbiased 200 uniform 200 binomial
Future Work • Improved Map visualization • Sentiment Data Maps. • Animated maps showing temporal changes in popularity. • Improved influence models. • Empirical justifications of models. • Improved bias estimators.