Download
1 / 17
170 likes | 299 Views
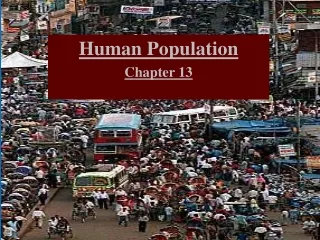
Human Population. 8. CHAPTER. Talk About It Is it ethical for governments to limit or encourage human population growth?. China’s One-Child Policy. In 1970, the average Chinese woman had about six children.

E N D
Human Population 8 CHAPTER
Talk About ItIs it ethical for governments to limit or encourage human population growth? China’s One-Child Policy • In 1970, the average Chinese woman had about six children. • Since 1979, China has used a system of rewards and punishments to enforce a one-child limit to slow population growth. • In 2005, there were 32 million more males than females in China under the age of 20.
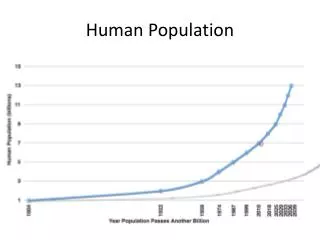
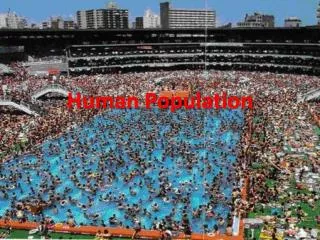
Lesson 8.1 Trends in Human Population Growth As of 2010, the human population is 6.8 billion (and counting).
Lesson 8.1 Trends in Human Population Growth History of Human Population Growth • Advances in agriculture and industry have led to longer lifespans and remarkable population growth. • Agriculture: Helped people meet their nutritional needs; increased free time to pursue crafts and trading • Industry: Improved sanitation, medicine, and food production Did You Know?Basic sanitation was rare even in the medical profession until 1861, when Dr. Ignaz Semmelweis discovered that doctors’ hand washing greatly reduced patient mortality.
Lesson 8.1 Trends in Human Population Growth Infant Mortality and Life Expectancy • Populations are likely to grow when infant mortality is low and life expectancy is high. • Infant mortality: Number of babies out of 1000 that die during their first year of life • Life expectancy: Average number of years a person is expected to live • Population growth rate describes the change in population’s size during a given period of time.
Lesson 8.1 Trends in Human Population Growth Recent Trends in Human Population Growth • Growth rate of human population has slowed from 2.1% to about 1.2% since the 1960s. • Population growth rates vary by region. Some nations have negative population growth rates, meaning the population is getting smaller. • Humans use technology to extend Earth’s carrying capacity for our species. Did You Know?To estimate how long it would take any population to double, divide 70 by its growth rate.
Lesson 8.1 Trends in Human Population Growth Demography: Describing the Human Population • Population size: Number of people • Population density: Number of people living per mi2 (or per km2) • Population distribution: How people are distributed within an area
Lesson 8.2 Predicting Population Growth Some scientists predict that there will be 9 billion people on Earth by 2050, while others maintain that the population will be closer to 10.5 billion.
Fertility Rate Lesson 8.2 Predicting Population Growth • Total fertility rate: Average number of children a female has during her life • Replacement fertility rate: The total fertility rate for a nation that would keep its population stable • For most nations, a replacement fertility rate of 2.1% would keep population size stable. A greater rate would increase population size; a lesser rate would decrease it.
Lesson 8.2 Predicting Population Growth Age Structure • Age structure describes the relative number of people within different age brackets in a population. • A population of mostly young people tends to grow. A population of mostly old people tends to shrink. • A population with equal numbers of young and old tends to remain stable in size.
Lesson 8.2 Predicting Population Growth Sex Ratio • Describes the relative numbers of females and males • Typical sex ratio for humans is 1.00 females : 1.06 males. For every 100 females born, 106 males are born. • Human activity such as migration can skew sex ratios.
Lesson 8.2 Predicting Population Growth The Demographic Transition • Model that explains a population’s change from high birthrates and death rates to low birthrates and death rates • Pre-industrial stage: Birthrates and death rates are high. • Transitional stage: Birthrates are high but death rates are declining. • Industrial stage: Birthrates start to decline; death rates stay low. • Post-industrial stage: Both birthrates and death rates fall to low and stable levels. • Demographic transitions are the result of economic growth and social changes. Did You Know?Over the past 50 years, worldwide average life expectancy has increased from 46 to 68 years.
Lesson 8.2 Predicting Population Growth Social Factors and Population Growth • Developing nations: • Higher fertility, infant mortality, and death rates • Lower life expectancy • Low per capita resource use • Developed nations: • Lower fertility, infant mortality, and death rates • Higher life expectancy • High per capita resource use Did You Know?On average, 1 American consumes as much natural resources as 5 Chinese or 13 Pakistanis.
Lesson 8.3 People and Their Environments Globally, the average ecological footprint is 2.3 hectares. The average American has an ecological footprint of 9.0 hectares.
Lesson 8.3 People and Their Environments Environmental Impacts • The environmental impact of humans depends on the way they live. • Poorer societies tend to have smaller ecological footprints than affluent societies, but still strain the environment: • Overwhelmed governments can’t supply clean water or adequate sewage treatment. • Poverty often leads to land overuse. • Deforestation, flooding, disease, and habitat loss can become common, as land is cleared for farming.
Lesson 8.3 People and Their Environments The Wealth Gap • Currently, the richest 20% of the world’s people use 86% of its resources. • As developing nations such as China continue to develop, new environmental problems will emerge, as the need for and use of resources increases. • Resource availability affects quality of life. Did You Know?Globally, 1.4 billion people live on less than $1.25 per day, and another 2.6 billion live on less than $2 per day. Burning of fossil fuels creates a haze of pollution over the eastern coast of China.
Lesson 8.3 People and Their Environments Impacts of Technology • Negative impacts: • Has enabled resource exploitation • Has resulted in pollution, biodiversity loss, and climate changes • Positive impacts: • Enables longer, healthier, more comfortable lives • Technologies such as recycling can help reduce environmental impact. • Renewable energy technology can produce cheap, clean energy. Solar water pump