Download
1 / 14
140 likes | 144 Views
This study investigates TPC aging in the STAR experiment using dE/dx measurements. The calibration procedure, corrections, and previous attempts are discussed. The aging effects observed in pp500 versus pp200 runs are presented, along with extrapolations. The results highlight the importance of TPC distortion corrections and provide insights into TPC aging.

E N D
Estimation of TPC Aging Based on dE/dx Measurements Yuri Fisyak fisyak@bnl.gov
Outline • Some details of STAR dE/dx calibration (procedure, corrections,…) • Previous attempts to observe TPC aging. • Run IX: • pp500 versus pp200, • Observed TPC aging, • Extrapolations. • Conclusions fisyak@bnl.gov
STAR dE/dx Calibration • The dE/dx calibration is based on a sample of global tracks reconstructed in TPC with momenta in range 0.4 GeV/c < p < 0.5 GeV/c (MIP for pion). For runs with high luminosity (and high rate of pile-up events) these global track sample is restricted to tracks associated with triggered primary vertex in order to avoid problems with wrong distortion corrections due to poorly defined Z coordinate for pile-up hits. • dE/dx corrections include: • Relative pad gain calibration based on pulser runs (done online and use for online clustering) • Restriction cluster sample : • to non overlapped clusters, and • removing clusters near sectors edges where cluster charge (gas gain) significantly drops (5 pads). • “ADC Correction” => ADC nonlinearity corrections, accounting for loss of signal due to: • to digitization and thresholds, • ADC saturation, and • rounding during cluster charge calculation. This correction has been obtained from TPC response simulation. For new TPC electronics this correction has not been obtained yet. • Essential part of the calibration is the TPC distortion corrections which effect the precision of dx measurement. • Set of multiplicative factors: • SecRow => “Gas gain” correction for sector/row, • Oxygen => Correction for Electron Attachment due to O2, • Pressure => Dependence of the Gain on Gas Density due to Pressure, • … • Length Correction => Correction for track <dE/dx> (30% truncated mean) variation versus track length used for the track <dE/dx> calculation due to cluster dE/dx dependence on dx. fisyak@bnl.gov
STAR dE/dx Calibration (cont.) • This is an example of such fit of z distribution for clusters in sector 1 and pad row 13. The fit is done with 5 mass hypotheses (represented by Gaussian with the same width) with fixed distance proton, kaon, electron and deuteron hypotheses from π. The fit parameters are: • Shift π peak from predicted position (“mu”), • A sigma of all Gaussians, and • Fraction of all mass hypotheses. • This procedure provides precision better than 1%. The main tool to obtain “multiplicative factors” is fit of Z-distributions for cluster binned for variable such as sector, row, pressure, … Z = log((dE/dx)measured/(dE/dx)π), where (dE/dx)π = B(p/m,dx) is prediction of Photo Absorption model (know in STAR as the “Bichsel model”) for π-mass hypothesis. fisyak@bnl.gov
STAR dE/dx Calibration (cont.) • On this plot relative dE/dx track resolutions versus the track length used for the dE/dx calculation for different RHIC run are presented. • The conclusions from this plot are: • The resolutions are about “achievable” value 7.6% @ 76 cm track length (Model estimation gives 7.3%). • There is no (at least obvious) time dependence. • There is a dependence on run conditions (mainly hit occupancies and distortion correction precision). fisyak@bnl.gov
Sigma versus row for different gains • In Run IX we have a few runs with reduced anode Voltage. • Rough dE/dx resolution estimation: • Nominal Voltage: • I = 0.435/√(0.713) = 14.4% • O = 0.41/√(0.732) = 8.7% • = 7.45% • Reduced Voltage Inner (relative gain 0.63 with respect to nominal) • I = 0.45/ √(0.713) = 14.9 % • = 7.51% • Reduced Voltage Inner and Outer (relative gain 0.63 with respect to nominal) • O = 0.425/ √(0.732) = 9.0% • = 7.7% • Reduction of gain for Inner sector practically (~0.06%) has no effect on dE/dx resolution but Outer sector gain reduction produces sizeable effect (~0.25%). fisyak@bnl.gov
Aging measurement based on dE/dx Attempt to estimated TPC aging, presented to 2006 TPC review. Gas Gain versus date. In the past we have tried to estimate TPC aging by comparison “gas gain” correction obtained during dE/dx calibration. This plot (left one, which shows that “gas gain” increase in inner sector with time) has demonstrated that in 2006 we did not control all parameters which influence our gas gain estimation. We could not state anything about TPC aging. A reason could be large variation of pad gains over long time interval (~ year) which can wash out any conclusion about “gas gain” time dependence. For the last run (IX) we have requested special data sample to try to evaluate aging (with new electronics) with hope that new electronics has much lower (<0.2%) pad variation (at least in a month time scale) which will allow to see aging effect on the level of ~1%. fisyak@bnl.gov
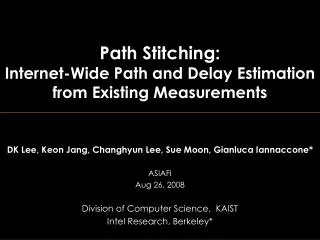
Comparison low luminosity runs pp500 and pp200 (Run IX data) • Here we compare data obtained at “low luminosity” at the beginning of pp500 (03/24/09) and the beginning of pp200 just after finishing pp500 (04/28/09). For this period it was collected 10 C for all Inner sectors and 10/3.18 = 3.15 C for Outer sectors (A.Lebedev’s estimation from slow control). • Thus accumulated charge per unit length of wire (assuming its 1/r2 charge dependence): • Inner: Q(<r>) = 10C /1.6 km = 62.5 C/cm at <r> = 81.4cm (row 5) • Outer: Q(<r>) = 2.63C/3.6km = 7.3 C/cm at <r> = 154.5 cm (row 28) • If we assume • R-1 = - Q/(G/G), • G ~ exp(-Q/R-1), and • Q = Q(<r>)(<r>/r)2 then fit gives • R-1 =2.8 0.3[mC/cm]. This value is a factor of 35 less usually claimed ~100[mC/cm]. fisyak@bnl.gov
Tripped anode channel • During Run IX pp500 data taking we were suffered from multiple trips in TPC. • This plot shows Gas gain ratios for : • All pad rows, • Pad rows which had multiple trips (>5), and • Pad row which did not have multiple trips. • The conclusion is that trips have negative effect on gas gain. fisyak@bnl.gov
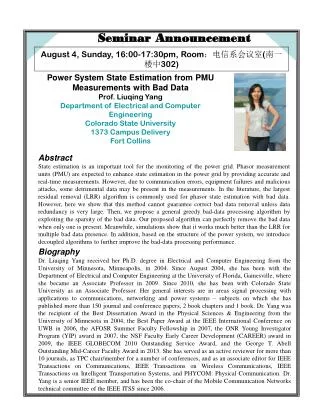
Extrapolation to 10 years of RHIC I and RHIC II luminosities • On this plot extrapolations to x10 and x40 accumulated charge are shown. • The major problems have started with x40 integrated luminosity for Inner Sector. fisyak@bnl.gov
R’ model R’ aging model: G ~ exp(-R’ √ Q) and Q = Q(<r>)(<r>/r)2 gives R’ =3.00.3[C/cm]-1/2. This value is pretty well matched with data for P10 aging (more in R.Witt talk). fisyak@bnl.gov
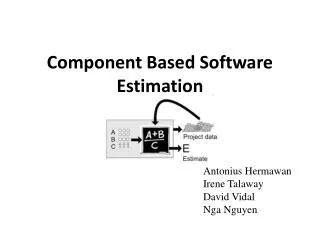
Extrapolation of R’ model to 10 years of RHIC I and RHIC II luminosities R’ model gives much more fair future for STAR TPC aging. fisyak@bnl.gov
Conclusions: • In run IX we have observed (the first time) degradation of Inner Sector gain which is consistent with TPC aging hypothesis. This result should be considered only as preliminary. We have to reevaluate this result using whole run IX data sample and watch the situation during the coming runs. • aging constant obtained with the present sample strongly depends on model • For G ~ exp(-Q/R-1) model fit gives R-1 =2.8 0.3[mC/cm], which is a factor ~30 less than expected, • For G ~ exp(-R’ √ Q) model fit gives R’ =3.00.3[C/cm]-1/2, which is consistent with our expectations. • Accumulated charge per unit wire length in STAR TPC so far it is still too small in order to give definite predictions for one or two order of magnitude higher integrated luminosity. fisyak@bnl.gov
1/R dependence fisyak@bnl.gov