Download
1 / 1
30 likes | 286 Views
TSpectrum class developments. Miroslav Morháč, Institute of Physics, Slovak Academy of Sciences, Bratislava, Slovakia. Introduction. Fitting.

E N D
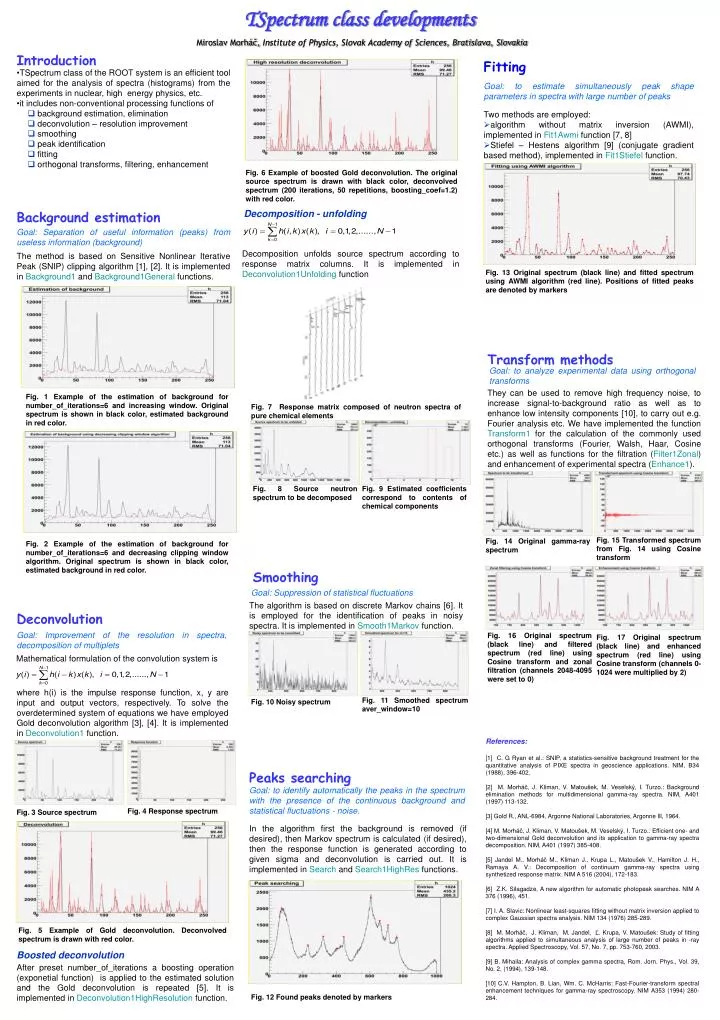
TSpectrum class developments Miroslav Morháč, Institute of Physics, Slovak Academy of Sciences, Bratislava, Slovakia Introduction Fitting • TSpectrum class of the ROOT system is an efficient tool aimed for the analysis of spectra (histograms) from the experiments in nuclear, high energy physics, etc. • it includes non-conventional processing functions of • background estimation, elimination • deconvolution – resolution improvement • smoothing • peak identification • fitting • orthogonal transforms, filtering, enhancement Goal: to estimate simultaneously peak shape parameters in spectra with large number of peaks • Two methods are employed: • algorithm without matrix inversion (AWMI), implemented in Fit1Awmi function [7, 8] • Stiefel – Hestens algorithm [9] (conjugate gradient based method), implemented in Fit1Stiefel function. Fig. 6 Example of boosted Gold deconvolution. The original source spectrum is drawn with black color, deconvolved spectrum (200 iterations, 50 repetitions, boosting_coef=1.2) with red color. Decomposition - unfolding Background estimation Goal: Separation of useful information (peaks) from useless information (background) The method is based on Sensitive Nonlinear Iterative Peak (SNIP) clipping algorithm [1], [2]. It is implemented in Background1 and Background1General functions. Decomposition unfolds source spectrum according to response matrix columns. It is implemented in Deconvolution1Unfolding function Fig. 13 Original spectrum (black line) and fitted spectrum using AWMI algorithm (red line). Positions of fitted peaks are denoted by markers Transform methods Goal: to analyze experimental data using orthogonal transforms They can be used to remove high frequency noise, to increase signal-to-background ratio as well as to enhance low intensity components [10], to carry out e.g. Fourier analysis etc. We have implemented the function Transform1 for the calculation of the commonly used orthogonal transforms (Fourier, Walsh, Haar, Cosine etc.) as well as functions for the filtration (Filter1Zonal) and enhancement of experimental spectra (Enhance1). Fig. 1 Example of the estimation of background for number_of_iterations=6 and increasing window. Original spectrum is shown in black color, estimated background in red color. Fig. 7 Response matrix composed of neutron spectra of pure chemical elements Fig. 8 Source neutron spectrum to be decomposed Fig. 9 Estimated coefficients correspond to contents of chemical components Fig. 15 Transformed spectrum from Fig. 14 using Cosine transform Fig. 2 Example of the estimation of background for number_of_iterations=6 and decreasing clipping window algorithm. Original spectrum is shown in black color, estimated background in red color. Fig. 14 Original gamma-ray spectrum Smoothing Goal: Suppression of statistical fluctuations The algorithm is based on discrete Markov chains [6]. It is employed for the identification of peaks in noisy spectra. It is implemented in Smooth1Markov function. Deconvolution Goal: Improvement of the resolution in spectra, decomposition of multiplets Fig. 16 Original spectrum (black line) and filtered spectrum (red line) using Cosine transform and zonal filtration (channels 2048-4095 were set to 0) Fig. 17 Original spectrum (black line) and enhanced spectrum (red line) using Cosine transform (channels 0-1024 were multiplied by 2) Mathematical formulation of the convolution system is where h(i) is the impulse response function, x, y are input and output vectors,respectively. To solve the overdetermined system of equations we have employed Gold deconvolution algorithm [3], [4]. It is implemented in Deconvolution1 function. Fig. 10 Noisy spectrum Fig. 11 Smoothed spectrum aver_window=10 References: [1] C. G Ryan et al.: SNIP, a statistics-sensitive background treatment for the quantitative analysis of PIXE spectra in geoscience applications. NIM, B34 (1988), 396-402. [2] M. Morháč, J. Kliman, V. Matoušek, M. Veselský, I. Turzo.: Background elimination methods for multidimensional gamma-ray spectra. NIM, A401 (1997) 113-132. [3] Gold R., ANL-6984, Argonne National Laboratories, Argonne Ill, 1964. [4] M. Morháč, J. Kliman, V. Matoušek, M. Veselský, I. Turzo.: Efficient one- and two-dimensional Gold deconvolution and its application to gamma-ray spectra decomposition. NIM, A401 (1997) 385-408. [5] Jandel M., Morháč M., Kliman J., Krupa L., Matoušek V., Hamilton J. H., Ramaya A. V.: Decomposition of continuum gamma-ray spectra using synthetized response matrix. NIM A 516 (2004), 172-183. [6] Z.K. Silagadze, A new algorithm for automatic photopeak searches. NIM A 376 (1996), 451. [7] I. A. Slavic: Nonlinear least-squares fitting without matrix inversion applied to complex Gaussian spectra analysis. NIM 134 (1976) 285-289. [8] M. Morháč, J. Kliman, M. Jandel, Ľ. Krupa, V. Matoušek: Study of fitting algorithms applied to simultaneous analysis of large number of peaks in -ray spectra. Applied Spectroscopy, Vol. 57, No. 7, pp. 753-760, 2003. [9] B. Mihaila: Analysis of complex gamma spectra, Rom. Jorn. Phys., Vol. 39, No. 2, (1994), 139-148. [10] C.V. Hampton, B. Lian, Wm. C. McHarris: Fast-Fourier-transform spectral enhancement techniques for gamma-ray spectroscopy. NIM A353 (1994) 280-284. Peaks searching Goal: to identify automatically the peaks in the spectrum with the presence of the continuous background and statistical fluctuations - noise. Fig. 4 Response spectrum Fig. 3 Source spectrum In the algorithm first the background is removed (if desired), then Markov spectrum is calculated (if desired), then the response function is generated according to given sigma and deconvolution is carried out. It is implemented in Search and Search1HighRes functions. Fig. 5 Example of Gold deconvolution. Deconvolved spectrum is drawn with red color. Boosted deconvolution After preset number_of_iterations a boosting operation (exponetial function) is applied to the estimated solution and the Gold deconvolution is repeated [5]. It is implemented in Deconvolution1HighResolution function. Fig. 12 Found peaks denoted by markers