Download
1 / 16
160 likes | 273 Views
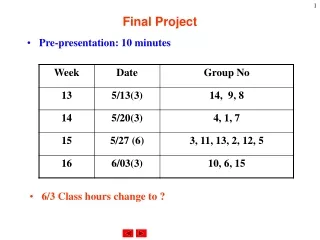
COMMON EVALUATION FINAL PROJECT Vira Oleksyuk. ECE 8110: Introduction to machine Learning and Pattern Recognition. Data sets. Two speech data sets Each has a training and a test data sets Set 1 10 dimensions; 11 classes 528/379/83 – training/development/evaluation Set 2

E N D
COMMON EVALUATIONFINAL PROJECTViraOleksyuk ECE 8110: Introduction to machine Learning and Pattern Recognition
Data sets • Two speech data sets • Each has a training and a test data sets • Set 1 • 10 dimensions; 11 classes • 528/379/83 – training/development/evaluation • Set 2 • 39 dimensions; 5classes • 925/350/225– training/development/evaluation • 5 sets of vectors for each class
Methods • K-Means Clustering (K-Means) • K-Nearest Neighbor (KNN) • Gaussian Mixture Model (GMM)
K-Means Clustering • It is a method of vector quantization, originally from signal processing, that is popular for cluster analysis in data mining. • k-means clustering aims to partitionn observations into k clusters in which each observation belongs to the cluster with the nearest mean, serving as a prototype of the cluster. This results in a partitioning of the data space into Voronoi cells. • K-Means aims to minimize the within-cluster sum of squares [5] • The problem is computationally difficult; however, there are optimizations • K-Means tends to find clusters of comparable spatial extent, while the expectation-maximization mechanism allows clusters to have different shapes.
K-Means Clustering • Euclidean distance is used as a metric and variance is used as a measure of cluster scatter. • The number of clusters k is an input parameter needed and convergence to a local minimum may be possible • A key limitation of k-means is its cluster model. The concept is based on spherical clusters that are separable in a way so that the mean value converges towards the cluster center. • The clusters are expected to be of similar size, so that the assignment to the nearest cluster center is the correct assignment. Good for compact clusters • Sensitive to outlayers
K-Means Clustering • Parameters: Euclidian distance; k selected randomly • Results • Not much change in error from changes in parameters
K-Nearest Neighbor • A non-parametric method used for classification and regression. • The input consists of the k closest training examples in the feature space. • The output is a class membership. An object is classified by a majority vote of its neighbors • KNN is a type of instance-based learning, or lazy learning, where the function is only approximated locally and all computation is deferred until classification. • the simplest of all machine learning algorithms. • sensitive to the local structure of the data.
K-Nearest Neighbor • The high degree of local sensitivity makes 1NN highly susceptible to noise in the training data. A higher value of k results in a smoother, less locally sensitive, function. • The drawback of increasing the value of k is of course that as k approaches n, where n is the size of the instance base, the performance of the classifier will try to fit to the class most frequently represented in the training data [6].
K-Nearest Neighbor • Results Set 2 • Results Set 1
Gaussian Mixtures Model • Is a parametric probability density function represented as a weighted sum of Gaussian component densities. • Commonly used as a parametric model of the probability distribution of continuous measurements or features in biometric systems (speech recognition) • Parameters are estimated from training data using the iterative Expectation-Maximization (EM) algorithm or Maximum A Posteriory (MAP) estimation from well trained prior model.
Gaussian Mixtures Model • Not really a model but a probability distribution • Unsupervised • Convecs combination of Gaussian PDF • Each has mean and covarience • Good for clustering • Capable of representing a large class of sample distributions • Ability to form smooth approximations to arbitrary smoothed densities [6] • Great for modeling human speech
Gaussian Mixtures Model • Results • Long computations
Discussion • Current performance:
Discussion • What can be done: • normalization of the data sets • removal the outliers • Improving on the clustering techniques • Combining methods for better performance
References [1] R.O. Duda, P.E. Hart, and D. G. Stork, “Pattern Classification,” 2nd ed., pp. , New York : Wiley, 2001. [2] C.M. Bishop, “Pattern Recognition and Machine Learning,” New York : Springer, pp. , 2006. [3]http://www.isip.piconepress.com/courses/temple/ece_8527/ [4]http://www.autonlab.org/tutorials/ [5] http://en.wikipedia.org/wiki/K-means_clustering [6]http://llwebprod2.ll.mit.edu/mission/cybersec/publications/publication-files/full_papers/0802_Reynolds_Biometrics-GMM.pdf