Download
1 / 31
310 likes | 457 Views
HIV Burden in India. Lalit Dandona Professor/Chair, International Public Health School of Public Health & George Institute for International Health The University of Sydney. 26 July 2007. Population / Public Health. Major tracks. Disease / health distribution

E N D
HIV Burden in India Lalit Dandona Professor/Chair, International Public Health School of Public Health & George Institute for International Health The University of Sydney 26 July 2007
Population / Public Health Major tracks • Disease / health distribution • Epidemiology, biostatistics • Society-health interactions • Social, behavioural, environmental sciences • Population health interventions • Health systems, health policy
HIV Studies in India • Population-based assessment of HIV distribution and risk factors • Risk behaviour of men who have sex with men and female sex workers • Impact of HIV interventions, including economic analysis To inform policies & programs
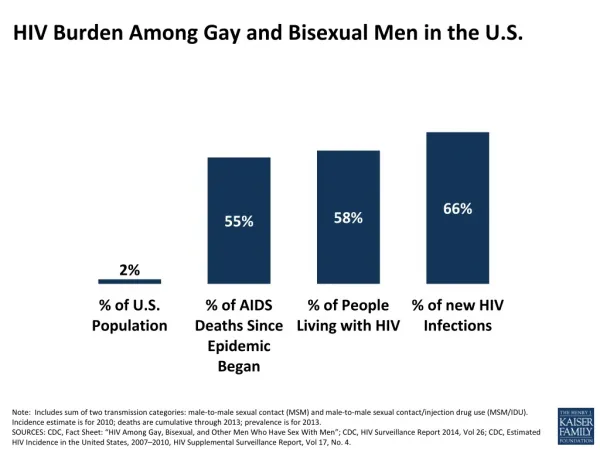
Background of HIV Burden in India • UNAIDS estimated in 2006 that India had the highest number of persons with HIV (5.7 million), but with a 3-fold plausibility range • HIV estimates in India calculated by NACO based predominantly on public sector sentinel surveillance data • No systematic comparison of this method with population-based data
Population-based HIV Study in Guntur District (4.5 million pop) Stratified random cluster sample to represent rural and urban populations Of the 13,838 sampled persons 15-49 years of age, 12,617 (91.2%) participated Rigorous quality control of field and laboratory procedures Dandona L et al. BMC Medicine 2006; 4: 31
Data Collection • September 2004 – September 2005 • Relevant ethics approvals • Informed consent, interview, blood sample as dried blood spots (DBS) • Demographic data, standard of living index (SLI), risk factors and health services use history
Laboratory Analysis • HIV antibody: Murex, Tridot • HIV p24 antigen: Murex, Vidas • HIV nucleic acid: Amplicor PCR • Established laboratory procedures used • Fortes et al. J Clin Microbiol 1989; 27: 1380-81 • Behets et al. J Clin Microbiol 1992; 30: 1179-82 • Panteleeff et al. J Clin Microbiol 1999; 37: 350-53 • Roth et al. Lancet 1999; 353: 359-63 • Quinn et al. AIDS 2000; 14: 2751-57 • Quality assurance procedures
Participation Profile of Sample Rural sampled (6790) Urban sampled (7048) Sampled women (3414) Sampled women (3573) Sampled men (3376) Sampled men (3475) Gave blood sample and interview (3096, 89.1%) Did not participate (272, 7.8%) Did not participate (175, 5.2%) Gave blood sample and interview (3135, 92.9%) Gave interview only (107, 3.1%) Gave blood sample only (0) Gave interview only (62, 1.8%) Gave blood sample only (4, 0.1%) Gave interview only (138, 3.9%) Gave interview only (77, 2.3%) Gave blood sample only (0) Did not participate (231, 6.5%) Gave blood sample and interview (3204, 89.7%) Gave blood sample and interview (3177, 93.1%) Did not participate (159, 4.7%) Gave blood sample only (1, 0.0%)
High Risk Groups in Sample Sample Participation (%) (%) Men visited woman sex worker Ever18.7 Last 6 months2.7 Identified woman sex workers 0.14 Men who had sex with men 2.1 Men who sold sex to men 0.26 Transport-related job – men 7.0 91.3 Unskilled labourers 31.6 92.1 Other regularly mobile jobs 7.2 92.8 Participation rates similar across age groups and marital status
Results of HIV Testing Fourth-generation ELISA for HIV antibody/antigen (Murex) (N =12,617) Positive (N = 242) Negative (N = 12,375) Third-generation ELISA for HIV antibody (Murex) 10% for quality assurance with fourth-generation ELISA (Murex) and PCR (Amplicor) (N = 1,238) PCR (Amplicor) for HIV nucleic acid in high-risk cases (N = 585) Positive (N = 238) Negative with ELISA & PCR (N = 1,238) Positive (N = 0) Negative (N = 584) Positive (N = 1) Negative (N = 4) Retested by fourth-generation ELISA (Vidas) Third-generation rapid test (Tridot) Positive (N = 2) Negative (N = 2) Positive (N = 238) p24 antigen test (Vidas) PCR (Amplicor) Positive (N = 2) Negative (N = 2) HIV-1 (N = 221) HIV-2 (N = 14) HIV-1 & HIV-2 (N = 3) Confirmed positive with PCR (Amplicor) Initially false positive
Guntur ANC vs. Population-based HIV Prevalence • 2005 sentinel surveillance • HIV 3% (12/400) • September 2004 – September 2005 • Among 10,504 women receiving PMTCT • (96.9% of new ANC registrations) • HIV 2.95% (95% CI 2.63-3.27%) • Population-based HIV rates • All1.72% (95% CI 1.35-2.09%) • Men 1.74% (95% CI 1.27-2.21%) • Women 1.70% (95% CI 1.36-2.04%)
HIV & Standard of Living Index • Entire sample • Up to 50th percentile of SLI: 2.58% • Above 50th percentile of SLI: 1.20% • HIV ratio for lowest-highest SLI quartiles • Urban: 3.47 • Rural: 2.37 • SLI gradient relatively lower for rural men
Private to Public Sector Referral Includes referrals due to HIV positive result and suspected HIV
Did We Under-estimate HIV? • Sampling and calculations • No known bias in sampling method for population • Under-represented high risk groups added • Participation rate of other high risk groups not low • Laboratory methods • Established storage and analysis methods used • Quality assurance procedures utilized No obvious reason for under-estimation in our methods
HIV Over-estimation with Official Method • STI clinic component added extra HIV to estimate • 70% extra • Profile of public ANC users • Referral of HIV positive and suspects • 46% extra • Higher representation of lower SLI • 28% extra
Can These Findings be Generalized? • STI clinic component in HIV estimation • Not used elsewhere in the world for HIV estimation from sentinel surveillance • Referral of HIV positive and suspects • A widespread phenomenon in India • Higher representation of lower SLI • Data from nationwide RCH survey
Indicative Estimates for India HIV estimate for India may be 3-3.5 million or lowerinstead of the official estimate of5.2 million 15-49 year old adults or 5.7 million total Dandona L et al. BMC Public Health 2006; 6: 308
Recommendations • Drop STI clinic component in the HIV estimation method used in India • Plan strategic and scientifically sound population-based HIV studies every 3-4 years in India to provide correction factors for ANC/PMTCT HIV rates to estimate burden • Rethink HIV surveillance strategy for India
Recent National DHS Survey in India • Sample of 103,000 men and women, 82% of eligible persons, tested for HIV • 0.3% of adults had HIV in population-based sample; 0.4% after adjusting for under- represented high-risk groups • In early July 2007, based on calculations by NACO & UNAIDS, the Health Minister announced HIV burden for India as 2.5 million (2-3.1 million)
New Lower HIV Burden in India Implications • Resource need for treatment less than projected • This freeing-up of resources could make relatively more resources available for prevention • Focus of HIV prevention efforts • More scientific basis needed for dynamics of HIV spread and impact of HIV interventions in India
Prevention vs. Treatment Original Health Research Output India 2002 Basic sciences49.6% Clinical sciences 47.1% Public health 3.3% Dandona L et al. BMC Public Health 2004; 4: 55
Health Research Output India versus Australia - 2002 Impact factor Impact factor per million pop per billion GDP-PPP India5.6 2.0 Australia991 39 Aus–Ind Ratio175 20 Dandona L et al. BMC Public Health 2004; 4: 55