Download
1 / 26
260 likes | 472 Views
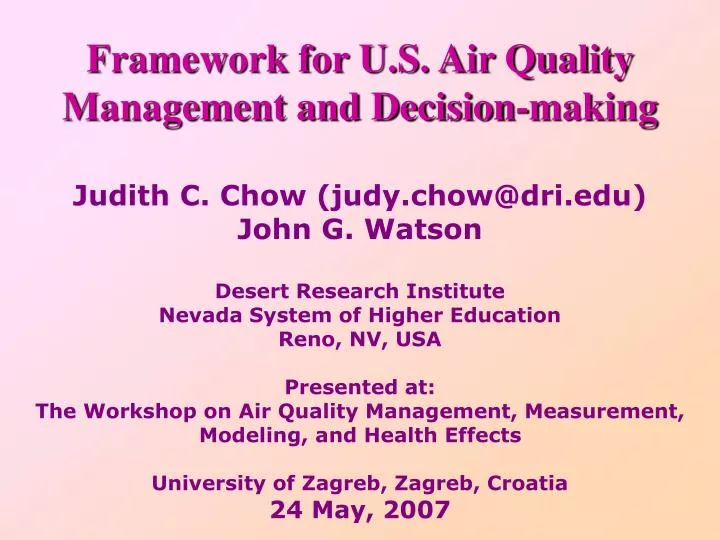
Framework for U.S. Air Quality Management and Decision-making. Judith C. Chow (judy.chow@dri.edu) John G. Watson Desert Research Institute Nevada System of Higher Education Reno, NV, USA Presented at: The Workshop on Air Quality Management, Measurement, Modeling, and Health Effects

E N D
Framework for U.S. Air Quality Management and Decision-making Judith C. Chow (judy.chow@dri.edu) John G. Watson Desert Research Institute Nevada System of Higher Education Reno, NV, USA Presented at: The Workshop on Air Quality Management, Measurement, Modeling, and Health Effects University of Zagreb, Zagreb, Croatia 24 May, 2007
Objectives • Review Air Quality Management Framework • Introduce NAAQS establishment process • Discuss new PM NAAQS • Specify timeline for implementation of standards
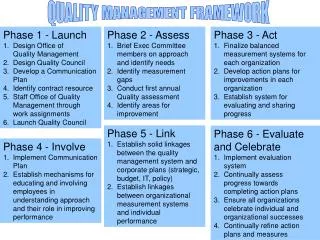
Framework for Air Quality Management Bachmann, JAWMA, 2007
U.S. Federal Air Pollution Control Legislation (1963-70) • The Clean Air Act (CAA) of 1963 • Develop and improve state/local air control programs (US$65M) • CAA Amendments of 1967 • Maintain state/local air programs (US$55M) • CAA Amendments of 1970 • Established structure for air quality management (U.S. EPA set NAAQS) • EPA to regulate stationary sources Technology-based standards for new sources Risk-based standards for hazardous air pollutants
Basic Facts about U.S. National Ambient Air Quality Standards (NAAQS) The Clean Air Act directs U.S. EPA to identify and set national standards for pollutants with adverse public health and environmental effects. The Clean Air Act also requires EPA to review each standard at least once every 5 years. US EPA established NAAQS for six criteria pollutants: ozone, carbon monoxide, sulfur dioxide, nitrogen dioxide, lead, and particulate matter (PM)
Setting and Achieving the NAAQS Setting the standards Health effects Environmental effects Achieving the standards Cost Time needed to attain the standards Key parts of a standard: Indicator (O3, PM2.5, etc.) Level (e.g., 0.12 ppm, 150 µg/m3) Averaging time (e.g., 1 hour, 24 hours, annual) Form (e.g., one exceedance per year, never to be exceeded)
NAAQS Review/Revision Process CASAC: Clean Air Scientific Advisory Committee
Ozone NAAQS timeline for areas classified as “transitional”
Limitations of the U.S. PM2.5 Standards • Causal relationships of PM2.5 to health not established; only epidemiological relationships • 24-hour average masks peak exposures of shorter duration • Highest concentrations neglected or attenuated by statistical form • Already regulated as a subset of existing PM10 standard • Is not accurately measured by practical Federal Reference Methods (FRMs) under all circumstances • Other indicators are more specific to respiratory and cardiovascular effects(several of these are due to available measurement technology)
Why use 98th Percentile for 24-hr NAAQS? • Statistical robustness • Statistically significant associations with health effects: • Mortality • Hospital Admissions • Respiratory symptoms
2006 versus 1997 PM2.5 NAAQS • Same levels for primary (health) and secondary (welfare) standards • Minor changes in ambient monitoring • More stringent spatial averaging requirements • More relaxed data completeness requirements • Simplification of reporting requirements
PM2.5 Federal Reference Methods (FRMs) Partisol SamplerThermo Fisher Scientific, formerlyRupprecht & Patashnick, Albany, NY URG MASS URG Corp., Raleigh, NC Andersen RAAS Thermo Fisher Scientific, formerly Andersen Instruments, Smyrna, GA BGI PQ-200 BGI, Inc., Waltham, MA
PM2.5 Monitoring Changes • Samplers with very sharp cut cyclones (VSCC) would be FRM (had been FEM) • Requires improved impactor oil for WINS • Time limit to recover samples increased from 96 to 177 hours • Allows up to 30 days* to condition and weigh retrieved filters when transit temperature is less than average ambient temperature during sampling *In the past, the number of days was determined by: days=34-T[°C]; T=storage temperature <25 °C
Size-selective Inlets Very sharp cut cyclone (VSSC) WINS Impactor
PM2.5 Spatial Averaging Changes* • Current • Correlation (r) ≥0.6 between monitor pairs • Difference ≤20% between monitor values • Proposed • Correlation (r) ≥0.9 between monitor pairs • Difference ≤10% between monitors * Determined on a seasonal basis
PM2.5 Data Completeness Changes • Required ≥75% data completeness per quarter • Collocated sampler data can substitute for missing primary sampler data • Allow 11 or more samples per quarter if calculated annual standard design value exceeds the NAAQS • For a quarter with < 11 samples, allow data substitution of an historically low 24-hr value (to reach 11 samples) if the results yield an annual mean, spatially averaged annual mean, and/or annual standard design value exceeding the NAAQS
PM2.5 Data Reporting Changes • No longer need to report the following parameters to EPA’s Air Quality System (AQS; http://www.epa.gov/ttn/airs/airsaqs/) • Flow rate • Coefficient of Variance • Sample volume • Minimum & maximum temperature • Minimum & maximum pressure • Continue to report: • PM2.5 concentration • Average temperature • Average pressure • State and local agencies need to retain information on parameters no longer reported to AQS
Why a Proposed PM10-2.5 Standard? • Court decision (D.C. Circuit in 1999 and 2001) • PM10 composed of PM2.5 • Need to regulate coarse PM independent of PM2.5 • Recent studies showing PM10-2.5 effects* • Inflammation and aggravation of allergic effects • Coughs in children • Increased hospital admissions *Generally stronger for short-term rather than long term effects
Limitations to the PM10-2.5 Standard • Includes any ambient mix of PM10-2.5 dominated by resuspended dust from high density traffic on paved roads and PM generated by industrial sources • Excludes any ambient mix of PM10-2.5 dominated by rural dust and soils and PM generated by agricultural and mining sources • Agricultural sources, mining sources and other similar crustal PM10-2.5-dominated sources shall not be subject to control in meeting this standard
Concerns about Proposed Revisions to PM Standards • Are levels set to provide an adequate margin of safety to protect sensitive populations, given the quality of the measurement and health effects data? • Should a separate short-term standard for PM2.5 be established based on visibility concerns? • Do measurement, characterization, and health-effects studies adequately support the cited differences in toxicity between rural and urban dust? • Why not control agricultural, mining and other non-urban dust sources?
For More Information: See the June issue of the Journal of the Air & Waste Management Association for the “Critical Review” by John Bachmann “Will the Circle be Unbroken: A History of the U.S. National Ambient Air Quality Standards.”