Download

1 / 16
160 likes | 166 Views
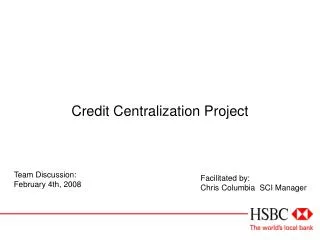
Centralization and ROP. A key component has a cost c = 10, holding cost h (for the period) = 1, salvage value v = 10, and sales price p = 19. What is the optimal target inventory level at each WH? What is the total inventory?. Warehouse A. Warehouse B. Demand N~(100,10^2).

E N D
Centralization and ROP • A key component has a cost c = 10, holding cost h (for the period) = 1, salvage value v = 10, and sales price p = 19. • What is the optimal target inventory level at each WH? • What is the total inventory? Warehouse A Warehouse B Demand N~(100,10^2) Demand N~(100,10^2)
Central Warehouse • What is the optimal target inventory level at CWH? Central Warehouse Demand N~(100,10^2) Demand N~(100,10^2)
Aggregate Forecast is More Accurate than Individual Forecasts
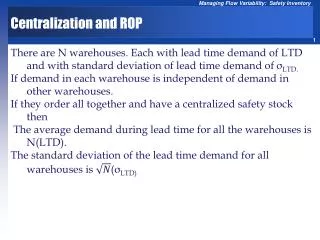
Physical Centralization • Physical Centralization: the firm consolidates all its warehouses in one location from which is can serve all customers. • Example: Two warehouses. Demand in the two ware houses are independent. • Both warehouses have the same distribution for their lead time demand. • LTD1: N(LTD, σLTD )LTD2: N(LTD, σLTD ) Both warehouses have identical service levels To provide desired SL, each location must carry Isafety = zσLTD z is determined by the desired service level The total safety inventory in the decentralized system is
Independent Lead time demands at two locations Decrease in safety inventory by a factor of LTDC = LTD1 + LTD2 LTDC = LTD + LTD = 2 LTD Centralization reduced the safety inventory by a factor of 1/√2 GE lighting operating 7 warehouses. A warehouse with average lead time demand of 20,000 units with a standard deviation of 5,000 units and a 95% service level needs to carry a safety inventory of Isafety = 1.65×5000= 8250
independent Lead time demands at N locations Independent demand in N locations: Total safety inventory to provide a specific SL increases not by N but by √N Centralization of N locations: If centralization of stocks reduces inventory, why doesn’t everybody do it? • Longer response time • Higher shipping cost • Less understanding of customer needs • Less understanding of cultural, linguistics, and regulatory barriers These disadvantages my reduce the demand.
Dependent Demand • Does centralization offer similar benefits when demands in multiple locations are correlated? • LTD1 and LTD2are statistically identically distributed but correlated with a correlation coefficient of ρ . No Correlation: ρ close to 0
+ Correlation, + Perfect Correlation Positive Correlation: ρ close to 1 Perfect Positive Correlation: ρ = +1 Negative Correlation: ρ close to -1 Perfect Negative Correlation: ρ = -1
The safety inventory in the two-location decentralized system is larger than in the centralized system by a factor of Correlation If demand is positively fully correlated, ρ = 1, centralization offers no benefits in the reduction of safety inventory Benefits of centralization increases as the demand on the two locations become negatively correlated. The best case is = -1, where we do not need safety inventory at all
Principle of Aggregation and Pooling Inventory • Inventory benefits due to principle of aggregation. • Statistics: Standard deviation of sum of random variables is less than the sum of the individual standard deviations. • Physical consolidation is not essential, as long as available inventory is shared among various locations Pooling Inventory • Virtual Centralization • Specialization • Component Commonality • Delayed Differentiation • Product Substitution
Virtual Centralization Virtual Centralization: inventory pooling in a network of locations is facilitated using information regarding availability of goods and subsequent transshipment of goods between locations to satisfy demand. • Location A • Exceeds Available stock Location B Less than Available stock 1. Information about product demand and availability must be available at both locations 2. Shipping the product from one location to a customer at another location must be fast and cost effective Pooling is achieved by keeping the inventories at decentralized locations.
Specialization, Substitution • Demand for both products exist in both locations. But a large portion of demand for P1 is in location A, while a large portion of demand for P2 is in location B. Location B Product P2 Location A Product P1 Both locations keep average inventory. Safety inventory is kept only in the specialized warehouse One other possibility to deal with variability is product substitution.
Component Commonality • Up to now we have discussed aggregating demand across various geographic locations, either physical or virtual • Aggregating demand across various products has the same benefits. • Computer manufacturers: offer a wide range of models, but few components, CPU, RMA, HD, CD/DVD drive, are used across product lines. • Replace Make-to-stock with make Make-to-Order • Commonality + MTO: • Commonality: Safety inventory of the common components much less than safety inventory of unique components stored separately. • MTO: Inventory cost is computed in terms of WIP cost not in terms of finished good cost (which is higher).
Postponement (Delayed Differentiation) • Forecasting Characteristic: Forecasts further into the future tends to be less accurate than those of more imminent events. • Since shorter-range forecasts are more accurate, operational decisions will be more effective if supply is postponed closer to the point of actual demand. • Two Alternative processes (each activity takes one week) • Alternative A: (1) Coloring the fabric, (2) assembling T-shirts • Alternative B: (1) Assembling T-shirts, (2) coloring the fabric • No changes in flow time. Alternative B postponed the color difference until one week closer to the time of sale. Takes advantage of the forecasting characteristic: short-Range forecast more accurate.
Postponement (Delayed Differentiation) • Two advantages: Taking advantage of two demand forecasting characteristics • Commonality Advantage: At week 0; Instead of forecast for each individual item, we forecast for aggregates item – uncolored T-shirt. Forecast for aggregate demand is more accurate than forecast for individual item. It is easier to more accurately forecast total demand for different colored T-shirts for next week than the week after the next. • Postponement Advantage: Instead of forecasting for each individual items two weeks ahead, we do it at week 1. Shorter rang forecasts are more accurate. It is easier to more accurately forecast demand for different colored T-shirts for next week than the week after the next.
Lessons Learned Levers for Reducing Safety Capacity • Reduce demand variability through improved forecasting • Reduce replenishment lead time • Reduce variability in replenishment lead time • Pool safety inventory for multiple locations or products • Exploit product substitution • Use common components • Postpone product-differentiation processing until closer to the point of actual demand