Download
1 / 10
100 likes | 237 Views
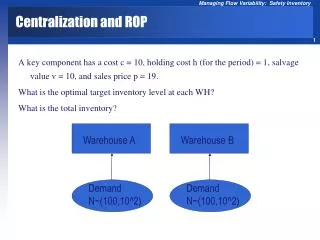
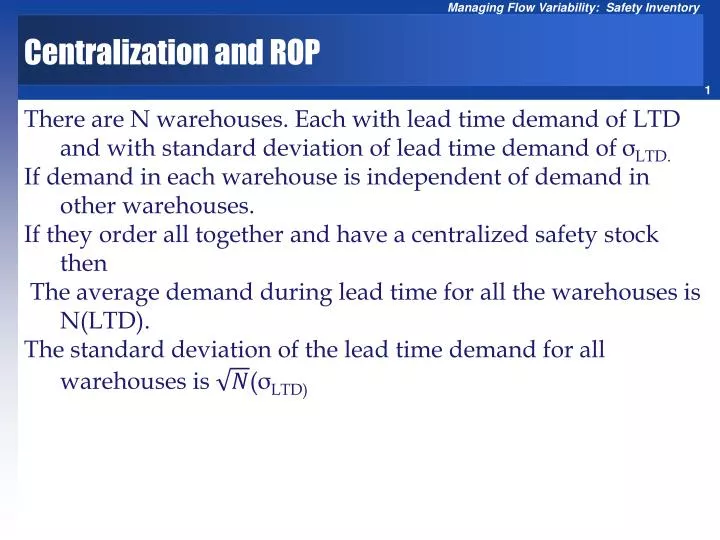
Centralization and ROP. There are N warehouses. Each with lead time demand of LTD and with standard deviation of lead time demand of σ LTD. If demand in each warehouse is independent of demand in other warehouses. If they order all together and have a centralized safety stock then

E N D
Centralization and ROP There are N warehouses. Each with lead time demand of LTD and with standard deviation of lead time demand of σLTD. If demand in each warehouse is independent of demand in other warehouses. If they order all together and have a centralized safety stock then The average demand during lead time for all the warehouses is N(LTD). The standard deviation of the lead time demand for all warehouses is (σLTD)
Centralization and ROP SL = 95% Isafety each = 1.65(10) Isafetyeach = 16.5 Isafety all = 33 Warehouse A Warehouse B Demand N(80,10) Demand N(80,10) Warehouse A Warehouse B SL = 95% Isafety all = 1.65(14.14) Isafetyall = 23.33 Demand N(160,)=N(160,14.14)
Independent Lead time demands at two locations GE lighting with 7 warehouses. LTD for each warehouse has mean of 20,000 units and StdDev of 5,000units and. Compute total Isafety at SL= 95% service level for centralized and decentralized systems. Isafety= 1.65×5000= 8250 is not 7(5000) is not 7(5000)2 ( 13228
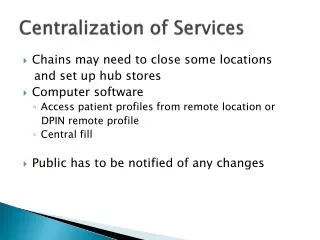
independent Lead time demands at N locations In Waiting Line; Centralization , or Polling, leads to (i) flow time reduction and (ii) throughput improvement. • In Inventory; Centralization leads to reduction in (i) cycle inventory, (ii) safety inventory, and (iii) flow time. • If centralization reduces inventory, why doesn’t everybody do it? • Longer response time • Higher shipping cost • Less understanding of customer needs • Less understanding of cultural, linguistics, and regulatory barriers These disadvantages may reduce the demand.
Principle of Aggregation and polling Inventory • Inventory benefits due to principle of aggregation. • Statistics: Standard deviation of sum of random variables is less than the sum of the individual standard deviations. • Physical consolidation is not essential, as long as available inventory is shared among various locations Polling Inventory • Virtual Centralization • Specialization • Component Commonality • Delayed Differentiation • Product Substitution
Virtual Centralization Virtual Centralization: inventory polling is facilitated using information regarding availability of goods and subsequent transshipment between locations. • Location A • Exceeds Available stock Location B Less than Available stock 1. Information about product demand and availability must be available at both locations 2. Shipping the product from one location to a customer at another location must be fast and cost effective Polling is achieved by keeping the inventories at decentralized locations.
Component Commonality • We discussed aggregating demand across various geographic locations, either physical or virtual • Aggregating demand across various products has the same benefits. • Computer manufacturers: offer a wide range of models, but few components are used across all product lines. • Replace Make-to-stock with make Make-to-Order • Commonality + MTO: • Commonality: Safety inventory of the common components much less than safety inventory of unique components stored separately. • MTO: Inventory cost is computed in terms of WIP cost not in terms of finished good cost (which is higher).
Postponement (Delayed Differentiation) • Forecasting Characteristic: Forecasts further into the future tends to be less accurate than those of more imminent events. • Since shorter-range forecasts are more accurate, operational decisions will be more effective if supply is postponed closer to the point of actual demand. • Two Alternative processes (each activity takes one week) • Alternative A: (1) Coloring the fabric, (2) assembling T-shirts • Alternative B: (1) Assembling T-shirts, (2) coloring the fabric • No changes in flow time. Alternative B postponed the color difference until one week closer to the time of sale. Takes advantage of the forecasting characteristic: short-Range forecast more accurate.
Postponement (Delayed Differentiation) • Two advantages: Taking advantage of two demand forecasting characteristics • Commonality Advantage: At week 0; Instead of forecast for each individual item, we forecast for aggregates item – uncolored T-shirt. Forecast for aggregate demand is more accurate than forecast for individual item. It is easier to more accurately forecast total demand for different colored T-shirts for next week than the week after the next. • Postponement Advantage: Instead of forecasting for each individual items two weeks ahead, we do it at week 1. Shorter rang forecasts are more accurate. It is easier to more accurately forecast demand for different colored T-shirts for next week than the week after the next.
Lessons Learned Levers for Reducing Safety Inventory • Reduce demand variability through improved forecasting • Reduce replenishment lead time • Reduce variability in replenishment lead time • poll safety inventory for multiple locations or products • Postpone product-differentiation processing until closer to the point of actual demand • Use common components • Exploit product substitution