Download
1 / 14
140 likes | 239 Views
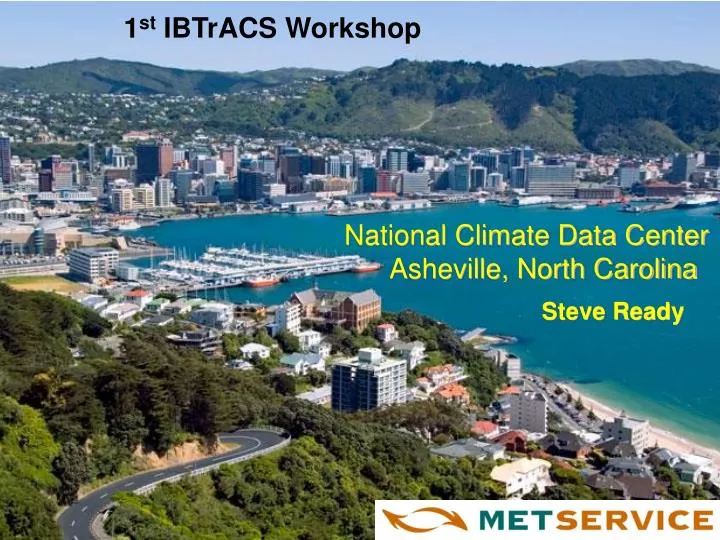
1 st IBTrACS Workshop. National Climate Data Center Asheville, North Carolina. Steve Ready. Wellington (New Zealand) TC area of responsibility. 25 ⁰ S. 40⁰S. 160 ⁰ E. 120 ⁰ W. Wellington – furtherest TCWC from the equator. Wellington TC AoR in red.

E N D
1stIBTrACS Workshop National Climate Data Center Asheville, North Carolina Steve Ready
Wellington (New Zealand) TC area of responsibility 25⁰S 40⁰S 160⁰E 120⁰W Wellington – furtherest TCWC from the equator
Wellington TC AoR in red Wellington AoR for ALL warnings = Subtropic + Pacific + Southern + Forties – yellow strip (Australian area)
Relevant to tracking TCs in Wellington AoR (1) • TC cloud system is normally well-sheared at 25S i.e. Nadi/Wellington boundary • Nearly all TCs have been reclassified as a “depression formerly cyclone…” before crossing 30S • A few TCs cross into Wellington AoR with a distinguishable eye but remains of CDO have normally merged with main cloud-band on the poleward side at 30S
Reclassification after TC crosses Nadi/Wellington boundary TC Meena near boundary Life as an XTC begins + + Remains of CDO merges with cloud-band on poleward side
Relevant to tracking TCs in Wellington AoR (2) • Wellington AoR is nearly all oceanic and very data sparse • Rely on QuikSCAT data for winds around cyclone circulation • Microwave imagery very useful for locating the low cloud centre in a shearing TC especially overnight • 25S 160E represents a point where Brisbane, Nadi and Wellington TC areas of responsibility converge
TC near Brisbane/Nadi/Wellington boundary triple point 160E 0000 UTC 13-Jan-2005 Brisbane warning copied by both Nadi and Wellington 25S 25S Triple point (25S 160E)
Historical Overview of Wellington’s TC database • Pre-1998: Operational tracks produced on a paper chart. Track re-analysis completed on a separate chart. Best track data keyed into a very basic database. • 1998 to 2005: Operational and best track data entered into a stand-alone database developed in-house and called “CyTRACK” • 2006 onwards: A lot of CyTRACK’s functionality was integrated into SNOWIE allowing access to a range of observational, analysis and NWP data. • SNOWIE: System for Natural Onscreen Weather Information Exploitation - forecasters’ interactive chart analysis and diagnostic tool
Pre-1998 Re-analysis was carried out on paper before track points were keyed in
2006 onwards… 3 windows in SNOWIE for gathering data over networking & databasing work
Current Database (1) • Access via SNOWIE tool • Operational track copied as a starting point • All observations (synops, ships, metars, buoys, 3000ft winds, scatterometer) displayed • Satellite imagery (in SNOWIE) • Other satellite data on NRL Monterey Tropical Cyclone Page
Current Database (2) Independent TC analysis bulletins obtained off GTS Original MSLP analysis displayed & able to be modified Possibly additional ship information e.g. barograph Near common boundaries – best track checked against Brisbane’s and Nadi’s Best tracks examined for irregularities & inconsistencies
Can’t beat Wellington on a good day even if the breeze is more than you wish for. Care for a dip in Wellington harbour? 17C? you might be lucky!