Download
1 / 40
400 likes | 539 Views
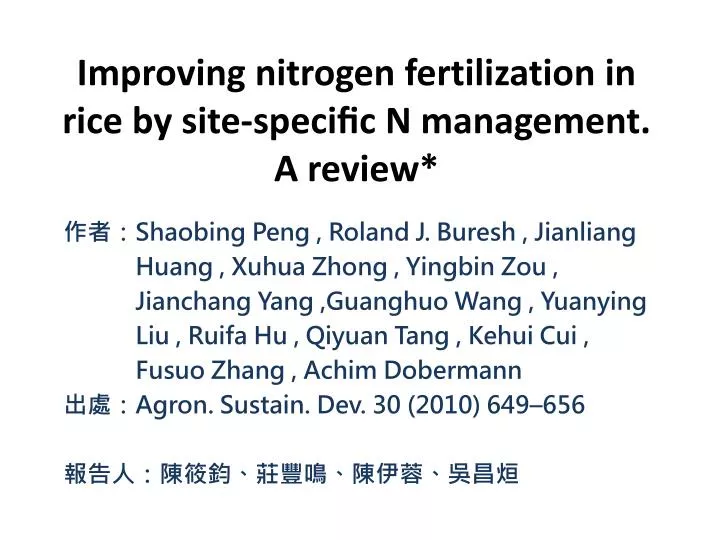
Improving nitrogen fertilization in rice by site- specific N management. A review*. 作者: Shaobing Peng , Roland J. Buresh , Jianliang Huang , Xuhua Zhong , Yingbin Zou , Jianchang Yang , Guanghuo Wang , Yuanying Liu , Ruifa Hu , Qiyuan Tang , Kehui Cui ,

E N D
Improving nitrogen fertilization in rice by site-specific N management.A review* 作者:ShaobingPeng , Roland J. Buresh , Jianliang Huang , XuhuaZhong , YingbinZou , Jianchang Yang ,Guanghuo Wang , Yuanying Liu , RuifaHu , Qiyuan Tang , Kehui Cui , Fusuo Zhang , AchimDobermann 出處:Agron. Sustain. Dev. 30 (2010) 649–656 報告人:陳筱鈞、莊豐鳴、陳伊蓉、吳昌烜
Outline • Introduction -Nitrogen use efficiency -SSNM
Introduction • Increase in fertilizer nutrient input, especially N fertilizer,has contributed significantly to the improvement of crop yieldsin the world . • Over-application of N fertilizer may actually decrease grain yieldby increasingsusceptibility to lodging and damage from pests and diseases .
Introduction • China is currently the world’s largestconsumer of N fertilizer. • In 2006, annual N fertilizer consumption in China was31 million metric tons or 31.7% of the global N consumption. • China’s national average N rate for rice was193 kg ha− 1 in 2006, about 90% higher than the world average .
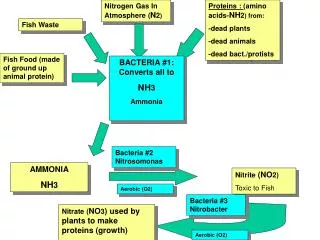
N-omission plots • Fertilizer N use efficiency can be measured in differentways using N-omission plots. 1.Fullfertilization:NPK applied 2.Nomission(–N):NoN applied, PK applied 3.Pomission(–P):No P applied, NK applied 4.Komission(–K):No K applied, NP applied - an N omission plot illustrates the deficit between the crop demand for N and indigenous supply of N, which must be met by fertilizers.
Nitrogen UseEfficiency • Total N rate. • Agronomic N use efficiency. • Recovery efficiency of fertilizer N. • Yield response to N application. • Partial factor productivity of apply N (PFP).
Nitrogen UseEfficiency(1) • Total N rate: -單位面積的所施的氮肥量,單位kg ha-1。 • Yield response to N application (Nresponse): -It is calculated as the difference between yields with and without N fertilizer. N response = YT - Y0 in kg ha-1
Nitrogen UseEfficiency(2) • Agronomic N use efficiency: -Theyield increase that results from N application in comparisonwith no N application . AEN = (YT - Y0 ) / FN = ΔY/ΔN in kg kg-1 = N response / total N rate
Nitrogen UseEfficiency(3) • Recovery efficiency of fertilizer N: -whichis used to expressthe percentage of fertilizer N recovered in aboveground plant biomass at the end of the cropping season. REN=(UT - U0)/FN= ΔU/ΔN inkgkg-1
Nitrogen UseEfficiency(4) • Partial factor productivity of apply N (PFP): - the ratio of grain yield to N appliedand it provides an integrative index that quantifies total economic output relative to utilization of all N resources in the system, including indigenous soil N and fertilizer N . PFPN=YT/FNinkgkg-1 =Grainyield/totalNrate
1. Zhu (1985) reported that recovery efficiency in China was less than 30% for ammonium bicarbonate and 30–40% for urea. 2. In China, agronomic N use efficiency was15–20 kg kg− 1 N from 1958 to 1963 and declined to only 9.1 kg kg− 1 N between 1981 and 1983 (Lin, 1991). 3. Peng et al.(2006) reported that rice yield increases by only 5 to 10 kg for every kg of N fertilizer input by using farmers’ N fertilizer practice in China.
SSNM • Site-specificNmanagement: SSNMwas developed to increase fertilizer N use efficiency of irrigated rice. In SSNM, N application is based on the crop demand for N.
-N-omission plots -chlorophyll meter (SPAD)、leaf color chart
Leaf N status • During thegrowing season, leaf N status measured with a chlorophyll meter (SPAD) or leaf color chart is a good indicator of crop N demand . transplanting, midtillering, panicle initiation and heading
The N rate • The pre-determined N rate is 30 kg ha− 1 at midtillering and 40 kg ha− 1 at panicle initiation. • The actual rates of N topdressing at midtillering and panicle initiation are adjusted by ± 10 kg N ha− 1 according to leaf N status measured with a SPAD or leaf color chart.
The four steps about SSNM… • Set an attainable yield target based on 85% of yield Potential. • Estimate indigenous N supply – yield without N fertilizer. • Estimate N response – the difference between target yield and yield without N fertilizer. • Estimate N rate based on N response and agronomic N use efficiency.
Improving nitrogen fertilization in rice by site-specific N management.A review Journal: Agronomy for Sustainable Development 30 (2010) 649–656 Author: ShaobingPenget al. 3. IRRI-CHINA COLLABORATION ON SSNM RESEARCH Speaker:莊豐鳴
SSNM experiment design • IRRI and China cooperation since 1997 • Data sources: -on-farm field trails in 5 provinces -on-farm demonstration in 6 provinces (J.G. Richardson, 2003) -farmer’s participatory research in 5 provinces (Rice knowledge bank, IRRI)
Distribution of experimental provinces 1997 2001 2003 2005 http://wenwen.soso.com/z/q176122474.htm
2001-2007 on-farm trails • 2001-2003in Zhejiang(浙江)、Guangdong(廣東) 、Hunan(湖南)及Jiangsu(江蘇)(Penget al, 2006)
A. 2001-2007 on-farm trails • 2005-2007 in Hubei(湖北)、Guangdong(廣東)、Hunan(湖南)及Jiangsu(江蘇)
2003-2005 Farmer participatory research(FPR) • 2003-2005 in Hubei(湖北)、Guangdong(廣東)、Hunan(湖南)and Jiangsu(江蘇). (Huet al., 2007) • Farmer participatory research:12-15 farmers in each study village and total 144 farmers. • Farmer-modified SSNM: Decrease N topdressing, and increase basal N.
B. 2003-2007 on-farm demonstrations • Six provinces: Zhejiang(浙江)、Guangdong(廣東)、Hunan(湖南)、Jiangsu(江蘇)、Hubei(湖北)and Heilongjiang(黑龍江) • One location is selected in each province, and 10 farmers are selected in each location. • Experimental design: SSNM with N omission plot Farmer’s N fertilizer practice http://www.knowledgebank.irri.org/ericeproduction/bodydefault.htm#pop_up_nutrient_omission_plot.htm
Data analysis • Pooled the data from 2001 to 2007 in 6 provinces (544 observations) • Compare SSNM with other N treatments • Analytic parameters: -yield -N response -Agronomic N use efficiency -Partial factor productivity of applied N(PFP)
Improving nitrogen fertilization in rice by site-specific N management. 4. Key research findings Speaker:陳伊蓉
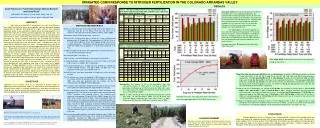
Table 1 • 107 farmers form six provinces in China between 2003 and 2007 • average grain yield of zero-N control was 5.69 t ha-1 across the 107 farmers SSNM Grain yield N rate N response Agronomic N use efficiency PFP
Table 2 • 25 on-farm field experiments conducted in five provinces in China between 2001 and 2007 • average grain yield of zero-N control was 5.69 t ha-1 across the 25 experiments SSNM Grain yield N rate N response Agronomic N use efficiency PFP
Grain yield and N rate of site-specific N management and other N treatments • site-specific N management • other N treatments Six provinces in China form 2001-2007
y = 2.16 + 0.886x (r = 0.70; n = 544) Six provinces in China form 2001-2007 Relationship between grain yield with and without N fertilizer 7.2 5.77
Relationship between yield response toN application and N rate • Six provinces in China form 2001-2007 • 544 observations • N response average 1.5 t ha-1 1.5
Relationship between yield response to N application and grain yield with N fertilizer Six provinces in China form 2001-2007
Relationship between agronomic N use efficiency and N rate Six provinces in China form 2001-2007
Relationship between agronomic N use efficiency and grain yield with N fertilizer Six provinces in China form 2001-2007
5. Remarks on site-specific N management 報告學生: 吳昌烜
Remarks on site-specific N management • High indigenous N supply capacity in China. • Reduce N rate during early vegetative stage • Total N rate is based on N response and AEN. • Experimental results • Indigenous N supply capacity • Adjustments of topdressing N rate by ±10 kg/ha at critical time based on leaf N status. Charlie fong
The Limitations of the SSNM • N response varies with the location across seasons. • Cropping history, variety, climatic condition • Total N rate can not be very accurate. • N response and AEN • Tillering capacity and early growth vigor. • Varietal differences • In-season adjustment of N rate by ± 10 kg/ha may be inadequate. • the magnitude of N response Charlie fong
Conclusion • SSNM is a matured technology. • AEN and yield of irrigated rice crop • For a better performance of SSNM. • N response and AEN • In-season adjustment on N rate. • Location, season and variety Charlie fong
Conclusion 推廣 • Simplify the procedure of SSNM. • To convince policy-makers. • To develop SSNM based on remote sensing technology for large scale practice. Charlie fong
http://autogatemalaysia.blogspot.com/2008/01/thank-you-thank-you-casa-asia-320h-casa.htmlhttp://autogatemalaysia.blogspot.com/2008/01/thank-you-thank-you-casa-asia-320h-casa.html