Download
1 / 36
360 likes | 498 Views
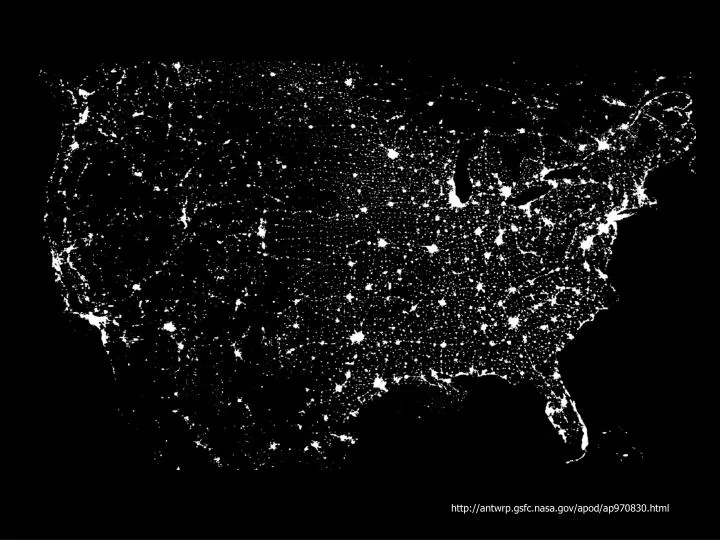
http://antwrp.gsfc.nasa.gov/apod/ap970830.html . Environmental Issues. I’ve returned all that were handed in before spring break. I have several more that I got after spring break. Please get your issue in by Friday of this week!.

E N D
Environmental Issues I’ve returned all that were handed in before spring break. I have several more that I got after spring break. Please get your issue in by Friday of this week! Did you notice some of the questions were based on fact or straightforward calculations, but others were very open ended, and the answer would depend on your opinions? That was intentional, of course. There were a couple of really loaded questions (intentionally) too. Since about 1980, US energy policy, as mandated by the citizens of the US, is based on the assumption that there will be no shortage of oil for the forseeable future.
Fossil Fuels US Energy Budget, 2008 (USDOE, quadrillion BTU). (posted June 2009; next update July 2010)
Fossil fuels account for over 80% of our energy input. Imports account for about 30% of our energy input. The impact of imported energy on our economy is (in my opinion) greater that it might appear at first glance: • Take away imported oil and our transportation and automobile industries collapse. • If these go, the rest of the economy goes. • Do you remember New Orleans, in the days after Katrina? We’d better “understand” fossil fuels!
Exponential Growth Before I talk any more about fossil fuels, I want you to see a crude simulation of exponential growth. And a simulation of exponential growth in use rate.
What are fossil fuels? • I’ll focus on these: • Oil • Natural Gas • Coal Where do these fuels come from? The ground! Duh. OK, how did they get there?
From the Texas Railroad Commission’s web site* “Before the age of the dinosaurs, steamy swamps filled with giant trees and large leafy plants covered many parts of the earth.” “As the trees and plants died, they sank to the swamp bottom where they formed layers of soggy dense material called peat.” “Over many centruies these beds of peat became buried by sand, clay and other mineral deposits forming sedimentary rock.” *Used because I judge it to be a “neutral” site in this area. Yes, they mis-spelled “centuries.” Sorry, no time for fancy pictures.
“As the weight of the sedimentary rock grew, the water was squeezed out of the peat and the increased heat and pressure compacted the peat to form coal.” “Most coal mined today is believed to have been formed about 300 million years ago.” “The early stages of coal formation still continues today as trees and plants in swampy areas die and decay to form peat.” A peat bog near Yorkshire, UK. You might be able to figure out where I found the picture. However, the process of making this new coal will take millions of years.
“Many factors, such as time, pressure, heat and plant material are involved in the formation of coal.” “As these factors vary, the coal produced may have different characteristics.” “Because coal is used as a fuel to produce heat, it is classified into four different types (ranks), based on the amount of heat it produces.” “These four rankings of coal are called anthracite (most heat), bituminous, subbituminous and lignite (least heat). Most of the coal mined in Texas is ranked as lignite.” This lecture is about fossil fuels. The last three slides describe coal formation. Oil is formed under similar conditions from the remains of sea life.
“This is disappointing. I thought when I burned coal (or gas), I was burning fossils. Like dinosaur fossils.” Nope, you’re burning hydro-carbons from lowly plant forms, or single-celled “animals.” I never said this class would be devoid of disappointments. “There’s no reason to worry about fossil fuel supply, because fossil fuels are being produced even as we speak.” True. Would you care to wait around 300 million years before you gas up your car again?
Oil Let’s focus on oil for a while. You can find it under old sedimentary rocks (e.g., Pennsylvania, 1859).
What did “we” do for heat and light before oil? • coal • wood • peat • whale oil • oil skimmed from surfaces of streams, lakes If you see pictures of Rolla from around or just after the Civil War, you will notice there are no trees. Anywhere. Civil War armies used them for campfires. Most of the trees you see now were planted during the early 19th century (or later).
The US has long been a leading producer of oil. Oil was a critical issue in the events leading up to World War II, and in the conduct of the war. In 1950, the US produced 50% of the world’s oil, dominated the market, and set prices. 19¢ a gallon gas was everywhere. In the mid-60’s, my two best friends and I would each chip in a quarter for gas, and go cruising all weekend long. Gas prices today are criminal, aren’t they? At an all-time high. Don’t get me started on that...
This “Stuart” person has a web page with lots of interesting random useless information, including the inflation-adjusted cost of his gas since 1979:
Until the 2006 hurricanes, gas prices fluctuated very little for 20 years. If you still want to complain about the price of gas, read this. (Background information: CATO is a conservative “think tank.”)
End of gas price rant. In the 1950’s, geophysicist M. King Hubbert proposed the following rules about depletion of a finite resource: • production starts at zero • production then rises to a peak which can never be surpassed • once the peak has been passed, production declines until the resource is depleted Based on these rules he predicted that US oil production would peak in the 1970’s and then decline… and was the target of ridicule by other geophysicists and economists. He remains the target of ridicule even today.
US oil production is documented by the Department of Energy: Your thoughts on these graphs?
The second “bump” in the production curve is a result of Alaskan oil coming on-line. http://www.wri.org/cpi/pubs/oil-cni.html
US oil reserves: • Texas 26% • Alaska 26% • California 16% • Gulf Coast offshore 9% • New Mexico 3% • Spread out 20% You may find different figures. That’s because the definition of “reserves” depends on who’s doing the talking.
Again, taking data from the DOE: petroleum consumption petroleum production
The result is, perhaps, inevitable: But you already know this part of the story… don’t you?
If it’s not good to import “foreign” oil, why don’t we just use “US” oil? We’d run out in 3 to 6 years! A couple of “secondhand” sources of this information; I have no reason to believe they are wrong: http://maps.unomaha.edu/Peterson/funda/Sidebar/OilConsumption.html http://www.hubbertpeak.com
Worse, Alaskan oil production is declining. “once the peak has been passed, production declines until the resource is depleted” References: newspaper, oil industry, extreme view (they are critical of both liberals and conservatives)
*!@&^ tree huggers won’t let us use Alaska’s ANWR oil! The amount there depends on who you believe. DOE says 5 billion barrels. Heritage Foundation (conservative think tank) says 16 billion barrels. USGS says 10.4 billion barrels recoverable. (source) US daily petroleum consumption: 19.4 million barrels/day. (source) (down from peak of 21 million/day) Let’s go with USGS estimate. 536 day supply (1.47 years, if consumption remains constant). Heritage’s 5.6 more barrels are not exactly thrilling. (The “good” news: it was 495 day supply in 2008.) more information here (not quite sure where this guy is coming from)
Why don’t we just find more “US” oil? • We’ve found the “easy” oil. We’ve scoured the country. We haven’t made any big discoveries since Alaska. • Why do oil company commercials make it sound like there’s an abundance of oil waiting to be found? It looks like we are going to be relying on imported oil for a long time. But remember, world oil is a finite resource. Will world oil production go through a peak, just like US oil production?
Why don’t we just find more “US” oil? We’ve found the “easy” oil. We’ve scoured the country. We haven’t made any big discoveries of easy-to extract oil since Alaska. What about the big discovery in the Gulf of Mexico. 3 to 15 billion barrel oil field discovered in 2006 about 5 miles below sea level. Remember how long 10 billion barrels lasts? Interesting observation: up until a couple of years ago, oil company TV commercials made it sound like there’s an abundance of oil waiting to be found. Now they’re talking up alternative energy sources.
Les Magoon and the Big Rollover Les Magoon of the USGS has 35 years of experience as a petroleum geoscientist. He presents us with this data. The volume of oil discovered worldwide peaked around 1965.
It’s not easy to find out about recent oil discoveries. 2007: a major oil discovery in Utah. 7000 barrels per day. Brazil, 2008, 33 billion barrels discovered offshore. Or maybe it is only a few hundred million barrels? See here. “It does cast new doubt on peak oil theory…” September 2009 BP announces giant discovery (they aren’t saying how much because they don’t know). Only 35,000 feet below the surface! March 22, 2010, Royal Dutch Shell, 100 million barrels of oil under 1.3 miles of water and 5 miles of rocks in the Gulf of Mexico. How many days would 100 million barrels last us?
Falklands Islands Oil Falkland Islands: 1998, oil companies drilled, found limited amounts of oil but showed the necessary conditions for presence of oil. “I published (with a colleague from Shell) a geochemical analysis suggesting that the source rock in the basin north of the Falklands could have been capable of generating and expelling anything from about 1.2 billion barrels of oil to over 60 billion barrels of oil.” (Geologist Phil Richards).
Also, “Only a very small percentage — maybe 10% — of any such hydrocarbons are likely to make it into a reservoir rock, and even if they do, and haven’t all leaked to the surface millions of years ago, only about 35% of that oil is likely to be extractable from the reservoir.” Oil companies picked up on the 60 billion barrel figure and started throwing the number around, followed by newspapers, web sites, etc. March 2008, drilling for oil to start in Falklands. Many web sites want you to invest money with them! Falklands oil disappointment, March 2010. Maybe 400 million barrels (4 day’s world supply), maybe nothing.
World oil production has lagged discovery by 40 years (find it now, “use” it four decades later).
“The Big Rollover” comes when we have pumped half the worlds oil, and start on the downward slope… …just like M. King Hubbert predicted a half a century ago. When will “the Big Rollover” take place? I wonder why the “Hydrogen Now” people are so excited about the Big Rollover... A lot depends on how much oil “we” really have. To be continued.