Download

1 / 58
580 likes | 597 Views
Learn about how Hidden Markov Models can be used to analyze sequential data and extract valuable information from it. Explore examples in text, online handwriting, music notes, DNA sequences, and program codes. Understand the concepts of state transition probabilities, symbol emission probabilities, and how to compute the probability of an observation sequence. Discover the applications of HMMs in speech recognition and language modeling.

E N D
Hidden Markov Models CSCE883
Sequential Data • Often highly variable, but has an embedded structure • Information is contained in the structure
More examples • Text, on-line handwiritng, music notes, DNA sequence, program codes • main() { char q=34, n=10, *a=“main() { • char q=34, n=10, *a=%c%s%c; printf( • a,q,a,q,n);}%c”; printf(a,q,a,n); }
Example: Speech Recognition • Given a sequence of inputs-features of some kind extracted by some hardware, guess the words to which the features correspond. • Hard because features dependent on • Speaker, speed, noise, nearby features(“co-articulation” constraints), word boundaries • “How to wreak a nice beach.” • “How to recognize speech.”
Markov model • A markov model is a probabilistic model of symbol sequences in which the probability of the current event is conditioned only by the previous event.
Symbol sequences • Consider a sequence of random variables X1, X2, …, XN. Think of the subscripts as indicating word-position in a sentence. • Remember that a random variable is a function, and in this case its range is the vocabulary of the language. The size of the “pre-image” that maps to a given word w is the probability assigned to w.
What is the probability of a sequence of words w1…wt? This is…P(X1 = w1 and X2 = w2 and…Xt = wt) • The fact that subscript “1” appears on both the X and the w in “X1 = w1“ is a bit abusive of notation. It might be better to write:
By definition… This says less than it appears to; it’s just a way of talking about the word “and” and the definition of conditional probability.
We can carry this out… This says that every word is conditioned by all the words preceding it.
The Markov assumption What a sorry assumption about language! Manning and Schütze call this the “limited horizon” property of the model.
Stationary model • There’s also an additional assumption that the parameters don’t change “over time”: • for all (appropriate) t and k:
appeared 0.8 dog big 0.6 0.2 0.5 0.4 just the 0.2 0.4 0.4 0.5 0.8 1 cat old died 0.2 P( “the big dog just died” ) = 0.4 * 0.6 * 0.2 * 0.5
Hidden Markov model • An HMM is a non-deterministic markov model – that is, one where knowledge of the emitted symbol does not determine the state-transition. • This means that in order to determine the probability of a given string, we must take more than one path through the states into account.
Relating emitted symbols to HMM architecture There are two ways: • State-emission HMM (Moore machine): a set of probabilities assigned to the vocabulary in each state. • Arc-emission HMM (Mealy machine): a set of probabilities assigned to the vocabulary for each state-to-state transition. (More parameters)
State emission p(a) = 0.2 p(b) = 0.7 … p(a) = 0.2 p(b) = 0.7 … p(a) = 0.2 p(b) = 0.7 … 0.15 0.15 0.85 0.85 0.75 0.75 0.25 0.25 p(a) = 0.7 p(b) = 0.2 … p(a) = 0.7 p(b) = 0.2 … p(a) = 0.7 p(b) = 0.2 …
Arc-emission (Mealy) p(a) =.03, p(b)=.105,… p(a) =.03, p(b)=.105,… p(a) =.17, p(b)=.595,… p(a) =.17, p(b)=.595,… p(a) = 0.525, p(b)=.15, … p(a) = 0.525, p(b)=.15, … p(a)= 0.175, p(b)=0,05,… p(a)= 0.175, p(b)=0,05,… Sum of prob’s leaving each state sum to 1.0
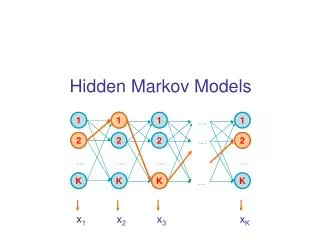
Definition Set of states S={s1, …, sN} Output alphabet K = {k1,…,kM} Initial state probabilities State transition probabilities Symbol emission probabilities State sequence Output sequence
Follow “ab” through the HMM • Using the state emission model:
½ * 0.2 * 0.85 = 0.085 0.015 + 0.263 = .278 ½*0.2 * 0.15 = 0.015 p(b) = 0.7 … p(a) = 0.2 0.15 0.15 e 0.85 0.85 0.5 Start 0.75 0.75 e 0.5 0.25 0.25 p(b) = 0.2 p(a) = 0.7 0.082 + 0.085 = 0.167 ½*0.7 * 0.25 = .082 ½* 0.7 * 0.75 = 0.263
0.015 + 0.263 = .278 pr( produce (ab) & this state ) = .278 * 0.7 = 0.1946 p(b) = 0.7 … p(a) = 0.2 0.15 0.85 0.75 0.25 p(b) = 0.2 p(a) = 0.7 0.082 + 0.085 = 0.167 pr(produce(ab) & this state) = 0.167 * 0.2 = 0.0334
P( produce (b) ) = .278 * 0.7 = 0.1946 0.1946 * 0.15 = 0.0292 p(b) = 0.7 … p(a) = 0.2 0.15 0.054 0.85 0.033 * 0.75 = .0248 0.1946 * 0.85 = 0.165 0.75 0.25 0.173 p(b) = 0.2 p(a) = 0.7 P(produce(b)) = 0.167 * 0.2 = 0.0334 0.033 * 0.25 = 0.0082
winner p(b) = 0.7 … p(a) = 0.2 0.15 0.194 0.054 0.85 0.75 0.25 0.173 0.033 winner p(b) = 0.2 p(a) = 0.7
What’s the probability of “ab”? p(b) = 0.7 … p(a) = 0.2 0.15 0.194 0.054 0.85 0.75 0.25 0.173 0.033 p(b) = 0.2 p(a) = 0.7 Answer: 0.054 + 0.173 – the sum of the probabilities of the ways of generating “ab” = 0.227. This is the “forward” probability calculation.
That’s the basic idea of an HMM Three questions: • Given a model, how do we compute the probability of an observation sequence? • Given a model, how do we find the best state sequence? • Given a corpus and a parameterized model, how do we find the parameters that maximize the probability of the corpus?
Probability of a sequence Using the notation we’ve used: Initialization: we have a distribution of probabilities of being in the states initially, before any symbol has been emitted. Assign a distribution to the set of initial states; these are p(i), where i varies from 1 to N, the number of states.
We’re going to focus on a variable called forward probability, denoted a. ai(t) is the probability of being at state si at time t, given that o1,…,ot-1 were generated.
Induction step: Transition from state i to this state, state j Probability at state i in previous “loop” Probability of emitting the right word during that particular transition. (Having 2 arguments here is what makes it state-emission.)
Side note on arc-emission: induction stage Transition from state i to this state, state j Probability at state i in previous “loop” Probability of emitting the right word during that particular transition
Forward probability • So by calculating a, the forward probability, we calculate the probability of being in a particular state at time t after having “correctly” generated the symbols up to that point.
We want to do the same thing from the end: Backward b This is the probability of generating the symbols from ot to oT, starting out from state i at time t.
Initialization (this is different than Forward…) • Induction • Total
Again: finding the best path to generate the data: Viterbi Dr. Andrew Viterbi received his B.S. and M.S. from MIT in 1957 and Ph.D. from the University of Southern California in 1962. He began his career at California Institute of Technology's Jet Propulsion Laboratory. In 1968, he co-founded LINKABIT Corporation and, in 1985, QUALCOMM, Inc., now a leader in digital wireless communications and products based on CDMA technologies. He served as a professor at UCLA and UC San Diego, where he is now a professor emeritus. Dr.Viterbi is currently president of the Viterbi Group, LLC, which advises and invests in startup companies in communication, network, and imaging technologies. He also recently accepted a position teaching at USC's newly named Andrew and Erna Viterbi School of Engineering.
Viterbi • Goal: find We calculate this variable to keep track of the “best” path that generates the first t-1 symbols and ends in state j.
Viterbi Initialization Induction Backtrace/memo: Termination
Next step is the difficult one • We want to start understanding how you can set (“estimate”) parameters automatically from a corpus. • The problem is that you need to learn the probability parameters, and probability parameters are best learned by counting frequencies. So in theory we’d like to see how often you make each of the transitions in the graph.
Central idea • We’ll take every word in the corpus, and when it’s the ith word, we’ll divide its count of 1.0 over all the transitions that it could have made in the network, weighting the pieces by the probability that it took that transition. • AND: the probability that a particular transition occurred is calculated by weighting the transition by the probability of the entire path (it’s unique, right?), from beginning to end, that includes it.
Thus: • if we can do this, • Probabilities give us (=have just given us) counts of transitions. • We sum these transition counts over our whole large corpus, and use those counts to generate new probabilities for each parameter (maximum likelihood parameters).
Here’s the trick: word “w”in the utterance S[0…n] each line represents a transition emitting the word w probabilities from each state (from Backward) probabilities of each state (from Forward)
prob of a transition line = prob (starting state) * prob (emitting w) * prob (ending state) each line represents a transition emitting the word w probabilities from each state (from Backward) probabilities of each state (from Forward)
probability of transition, given the data we don’t need to keep expanding the denominator – we are doing that just to make clear how the numerator relates to the denominator conceptually.
Sum over to-states Sum over the whole corpus
That’s the basics of the first (hard) half of the algorithm • This training is a special case of the Expectation-Maximization (EM) algorithm; we’ve just done the “expectation” half, which creates a set of “virtual” or soft counts – these are turned into model parameters (or probabilities) in the second part, the “maximization” half.
Maximization Let’s assume that there were N-1 transitions in the path through the network, and that we have no knowledge of where sentences start (etc.). Then the probability of each state si is the number of transitions that went from si to any state, divided by N-1. The probability of a state transition aij is the number of transitions from state i to state j, divided by the number of probability of state i.