Download
1 / 15
230 likes | 530 Views
Climate Graphs. Climate Graphs. Climate Graphs are very useful in comparing the annual temperature and rainfall of places around the world. They are very easy to plot and read. The simple steps below should show you how to draw one and then how to read it:. Steps to Plotting Climate Graphs.

E N D
Climate Graphs • Climate Graphs are very useful in comparing the annual temperature and rainfall of places around the world. They are very easy to plot and read. The simple steps below should show you how to draw one and then how to read it:
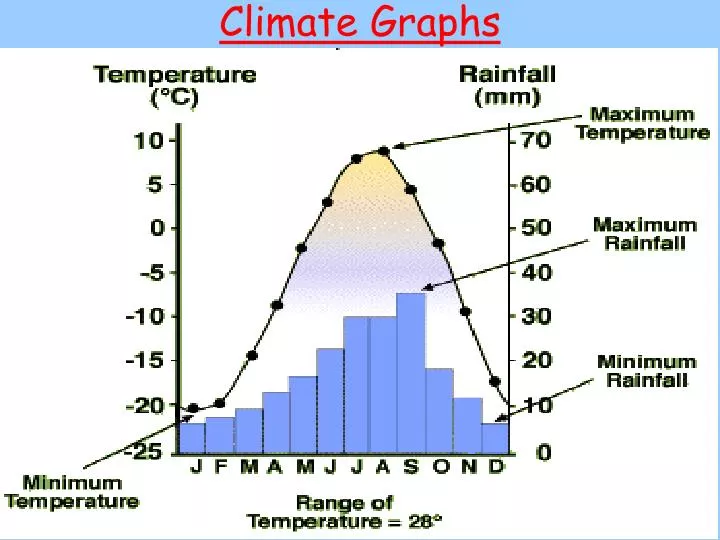
Steps to Plotting Climate Graphs • 1. Plot on the rainfall as a bar chart, coloured blue. • 2. Plot on the temperature as a line graph, coloured red. • 3. Finish it off by including the following: • - The total rainfall for the year (add all the bars together) • - The temperature range (the difference between the highest temperature and the lowest one). • - The name of the place that the graph is for.
Steps to Plotting Climate Graphs • The starting point for temperature should start from where December’s temperature dictates • The end point for temperature should finish towards January’s temperature • Each month’s temperature should be plotted in the middle of the month’s column
Yr 8 text book. Construct a climate graph for Singapore on p143, and then for Greenwich United Kingdom on p38 and then for Kalimantan p 153 that has a latitude of 4 degrees South
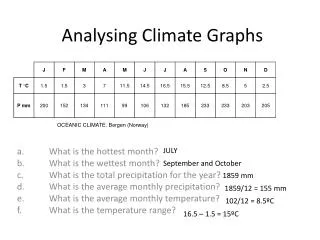
Climate graphs • ATHM: Average temperature of the hottest month • ATCM: Average temperature of the coldest month • Annual temperature range: Is the difference between the highest and lowest temperatures during the year • Average annual precipitation: 12 mths precipitation total. • Seasonal distribution of precipitation: Is it a summer or winter dominant distribution of rainfall
Steps to plotting climate graphs • http://www.s-cool.co.uk/topic_quicklearn.asp?loc=ql&topic_id=7&quicklearn_id=2&subject_id=20&ebt=101&ebn=&ebs=&ebl=&elc=4
Interactive Climate Map • http://www.uwsp.edu/geO/faculty/ritter/interactive_climate_map/climate_map.html