Download
1 / 7
70 likes | 87 Views
Climate graphs. An analysis of a climate graph should provide: The key features of the climate including: Warmest and coldest months Highest and lowest temperatures Range of temperature Wettest and driest months Highest and lowest monthly precipitation figures

E N D
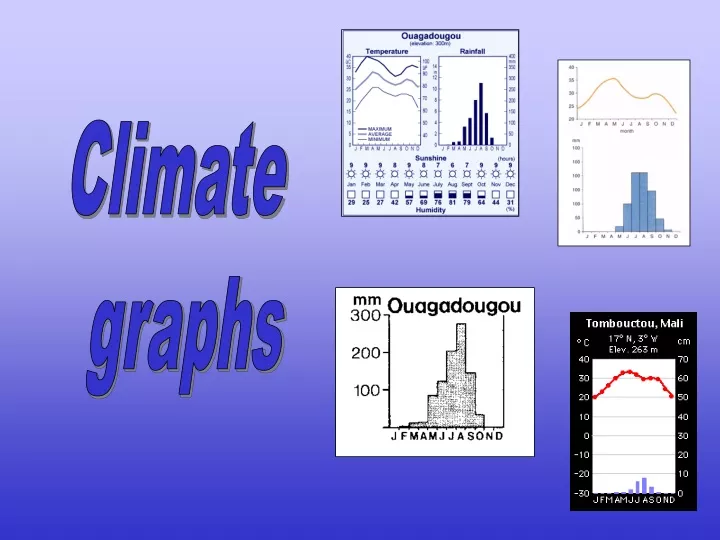
Climate graphs
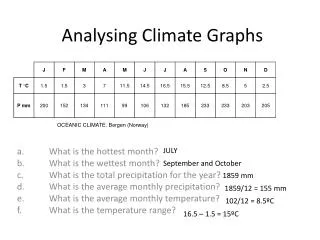
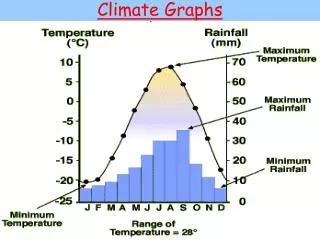
An analysis of a climate graph should provide: • The key features of the climate including: • Warmest and coldest months • Highest and lowest temperatures • Range of temperature • Wettest and driest months • Highest and lowest monthly precipitation figures • Total annual precipitation figure • Months with no rainfall • Months which make up the hot season/cold season, wet season/dry season
Patterns of temperature and precipitation should be described and, if necessary, explained. How to describe temperature and precipitation Use words and figures Quote actual figures from the graph
Remember that midsummer is in June in the northern hemisphere and in December in the southern hemisphere Is temperature about the same during the year When is the warmest season Describe its temperature in words and figures When is the coolest season Describe its temperature in words and figures Calculate the range of temperature Describe the temperature in words and figures
Is there rainfall all year? Calculate the total Describe the amount in words Is there hardly any rainfall all year? How many months have no rain at all and when? Is there rainfall for only part of the year? When is the wet season and the dry season? How much rain falls in each season?
Use the data to draw a climate graph of Lagos. Describe and explain the graph you have drawn