Download
1 / 14
140 likes | 256 Views
The U.S. West Coast — Gateway to America . Seattle. Tacoma. Portland. Oakland. Los Angeles. Long Beach. Service Network Cost Efficiency Reliability Responsibility. Growing Consumer Market. In the Year 2010 193 million consumers 63% of the total US population. In the Year 2030

E N D
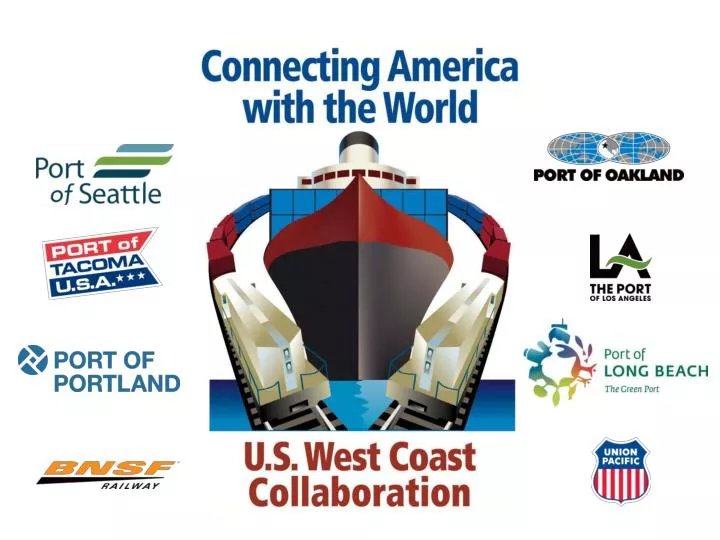
The U.S. West Coast — Gateway to America Seattle Tacoma Portland Oakland Los Angeles Long Beach Service Network Cost Efficiency Reliability Responsibility
Growing Consumer Market In the Year 2010 193 million consumers 63% of the total US population In the Year 2030 228 million people 35 million person increase (+18%)
Extensive Shipping Service Options Seattle Tacoma Portland Oakland Los Angeles Long Beach • Service String Choices • 25+ Carriers • 50+ Unique Service Strings • Calling at over 80 ports in 36 countries • 100+ Sailings to/from the West Coast per week
Deep Water Ports with Extensive Intermodal Market Coverage Provide the West Coast a Competitive Advantage Fast, efficient service to all major markets including Eastern points Benefits of West Coast Ports • Deep Water Handles Largest Vessels • Provides Lower Unit Costs • Maximizes number of Markets served per Port of Call • Broad Market Coverage from all West Coast Ports • Consistent Reliable Inland Service and Capacity • Lowest Total Delivered Inland Cost Tacoma & Seattle Portland Omaha Chicago Salt Lake City Denver Oakland St. Louis Kansas City Memphis Los Angeles & Long Beach Dallas El Paso New Orleans San Antonio Houston Laredo
UP’s Industry Leading Investment Program has Created Capacity to Support Significant West Coast Port Growth Recent Intermodal Terminal Investments I-5 Corridor Central Corridor Seattle/ Tacoma Portland 5 New Terminals 3 Terminal Expansions Chicago 2 Planned Terminals Omaha Denver North-South Texas Gulf Kansas City SLC N. Platte New Interchange Gateway Oakland St. Louis Utilizing a systematic, structured approach to add capacity and service performance Phoenix Los Angeles/ Long Beach Memphis El Paso Dallas Shreveport San Antonio New Orleans Houston Sunset Corridor Laredo
BNSF Gives You More • More Reach - 100% U.S. market coverage and 98% of the top 20 importers within 200 miles of an intermodal facility • More Capacity - The highest capacity intermodal routes • More Speed - The fastest intermodal service to inland markets • More Service - Over 70 new BNSF intermodal service offerings • More Environmental Benefits - Lower carbon emissions than all-water alternatives The World’s Largest Intermodal Network
BNSF’s $30 Billion Investment Drives Record-Breaking Service Performance Track Infrastructure Expansion Direct Service to the Southeast Intermodal Facility Innovations Advanced Technology High Capacity Trains
West Coast Ports Infrastructure Advantages 31 Container Terminals 5,110Acres 225Gantry Cranes $6.6 billion in container terminal, rail, dredging, roadway and other infrastructure improvement projects
Qingdao to Columbus – Distance by Gateway Nautical Intermodal Gateway miles Mileage Seattle / Tacoma 5,101 2,689 Portland 5,155 2,512 Oakland 5,408 2,383 LA / LB 5,706 2,478 Norfolk 11,274 422 New York / New Jersey 11,519 476
West Coast Carbon Emissions Advantages A study was conducted in 2009 to analyze CO2 output of trade routes. Following is the findings of emissions between Shanghai and U.S. Midwest gateways using various ports. Origin: Shanghai CO2 emissions (metric tons/TEU) Discharge Port Ship Size Chicago Columbus Memphis Seattle / Tacoma / Portland 6,500 TEU 1.579 1.664 1.715 Oakland 6,500 TEU 1.686 1.772 1.694 Los Angeles / Long Beach 6,500 TEU 1.672 1.757 1.672 New York via Panama Canal 4,500 TEU 2.520 2.468 2.574 Norfolk via Panama Canal 4,500 TEU 2.493 2.401 2.482 Savannah via Panama Canal 4,500 TEU 2.469 2.556 2.369 Houston via Panama Canal 4,500 TEU 2.470 2.510 2.323 • Transportation to mid-west locations via U.S. west coast has a smaller carbon footprint than other U.S. gateways. • Even in 2014, when the Panama Canal expansion is complete and larger ships begin to transit the canal, West Coast ports will maintain their carbon emissions advantage. Source: Herbert Engineering Corp.
West Coast Service Advantages Largest local market Largest intermodal market Most environmentally responsible No congestion (terminals, roadway, and rail) Largest pool of truck drivers and clean trucks that ensure reliability and compliance with BCO objectives and government requirements Largest national coverage Only ports capable of accommodating future large vessels Registered and well-trained longshore workforce with contract in place until 2014
The U.S. West Coast – Gateways to America • Service – Ocean carriers, railroads, trucking, other services/facilities • Network – Multiple ocean, road and rail routes • Cost Efficiency – Closest ports to Asia, lower fuel consumption, economies of scale • Reliability – Multiple ports/routing options, ample labor force, proven track record • Responsibility – Lowest carbon emissions to U.S. markets, proactive environmental programs
The U.S. West Coast – Gateways to America Connecting America with the World More Services More Options More Markets