Download
1 / 9
90 likes | 187 Views
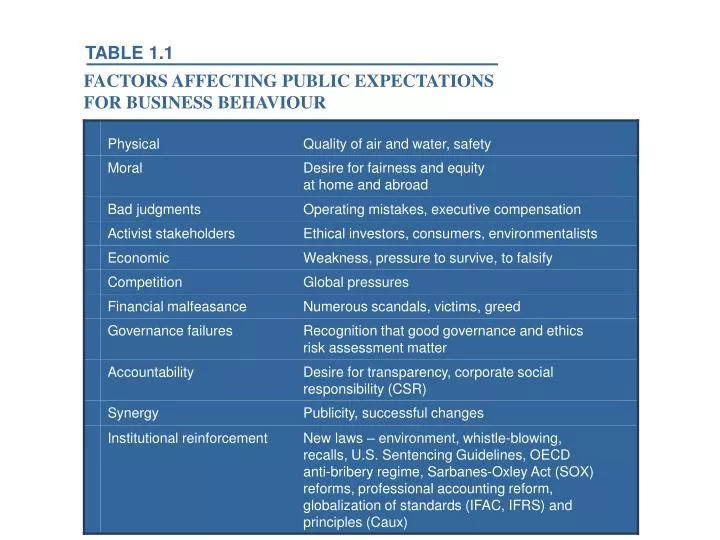
TABLE 1.1. FACTORS AFFECTING PUBLIC EXPECTATIONS FOR BUSINESS BEHAVIOUR. FIGURE 1.1. MAP OF CORPORATE STAKEHOLDER ACCOUNTABILITY. Shareholders. Activists. Employees. Governments. Customers. Corporation. Lenders & Creditors. Suppliers.

E N D
TABLE 1.1 FACTORS AFFECTING PUBLIC EXPECTATIONS FOR BUSINESS BEHAVIOUR
FIGURE 1.1 MAP OF CORPORATE STAKEHOLDER ACCOUNTABILITY Shareholders Activists Employees Governments Customers Corporation Lenders & Creditors Suppliers Others, including the media, who can be affected by or who can affect the achievement of the corporation’s objectives Competitors
FIGURE 1.2 CORPORATE GOVERNANCE FRAMEWORK Shareholders Stakeholders • Key Board Control Functions: • Set Guidance and Boundaries • - Policies, Codes, Culture, • Compliance – laws, regs, rules • Set Direction • - Strategies, Goals, • Remuneration, Incentives • Appoints CEO, who appoints • other executives, and CFO • Arrange for Resources • Monitor Feedback • - Operations, Policy Compliance, • Financial Reports • Reports to Shareholders, Govern. • Nominates/decides on Auditor Elect Board of Directors & Subcommittees: Audit, Governance, Compensation Auditor Legend: Info Flow Actions
TABLE 1.2 HYPERNORMS (BASIC VALUES)UNDERLYING STAKEHOLDER INTERESTS
FIGURE 1.3 DETERMINANTS OF REPUTATION Credibility Reliability Corporate Reputation Trustworthiness Responsibility Fombrun, p. 72
TABLE 1.3 RISK EVENTS CAUSING DROPS OF OVER 25% SHARE VALUE,PERCENTAGE OF FORTUNE 1000 COMPANIES, 1993-1998
TABLE 1.4 IMPORTANT RISK MANAGEMENT TERMS
TABLE 1.5 ETHICS RISKS–A REPRESENTATIVE LIST
TABLE 1.6 STAKEHOLDER REPORT TOPICS