Download
1 / 9
110 likes | 457 Views
COMPARING TWO POPULATIONS. IDEA: Compare two groups/populations based on samples from each of them. Examples. Compare average height of men and women. Draw sample of men heights: x1, x2, …, xm and a sample of women heights: y1, y2, …, yn. Test Ho:

E N D
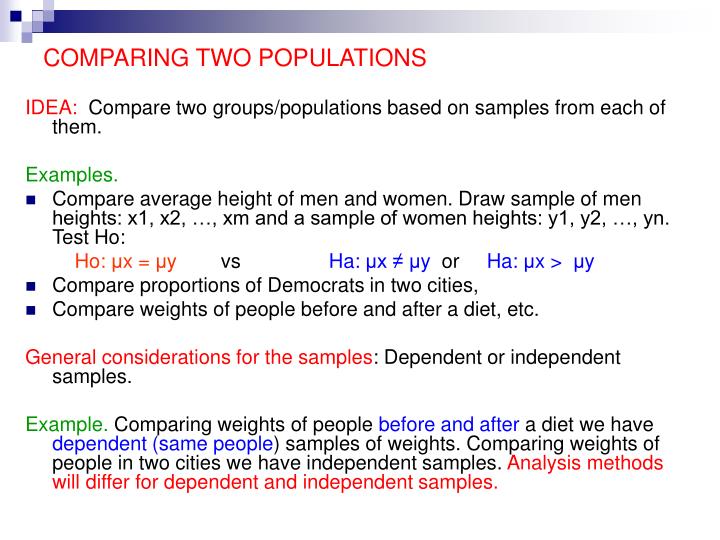
COMPARING TWO POPULATIONS IDEA: Compare two groups/populations based on samples from each of them. Examples. • Compare average height of men and women. Draw sample of men heights: x1, x2, …, xm and a sample of women heights: y1, y2, …, yn. Test Ho: Ho: μx = μy vs Ha: μx ≠ μy or Ha: μx > μy • Compare proportions of Democrats in two cities, • Compare weights of people before and after a diet, etc. General considerations for the samples: Dependent or independent samples. Example. Comparing weights of people before and after a diet we have dependent(same people) samples of weights. Comparing weights of people in two cities we have independent samples. Analysis methods will differ for dependent and independent samples.
PAIRED t-TEST: dependent samples Observations come as matched pairs (X,Y). X and Y are NOT independent, X and Y are dependent. Examples. • X is score on a test before studying hard; Y is score on the test after studying hard for the same student; • X is score on a test or in sports before training program, Y score after training program; • X is weight before weight loss program, Y is weight after the program; • X and Y are heights of twins or siblings.
PAIRED t-TEST: HYPOTHESES Hypotheses of interest: does training make a difference? μx = score before training; μy = score after training. Ho: μx = μy vs Ha: μx < μy (no difference) (score after training is higher) Data are pairs of observations: (x1, y1), (x2, y2), …, (xn, yn). Typically, we work with differences: d=X-Y, and phrase hypotheses in terms of differences: μd = true mean difference. In terms of differences: Hypotheses e.g. Ho: μd = 0 vs Ha: μd < 0 Data: d1, d2, …, dn.
PAIRED t-TEST: TEST PROCEDURE To test Ho, we do one sample t-test. Need sample mean and standard deviation of d’s: Compute the test statistic: Under Ho the test statistic has t(n-1) distribution. Make decision in exactly the same way as for the one sample t-test. A (1-α)100% CI for d:
PAIRED t-TEST: an example The amount of lactic acid in the blood was examined for 10 men, before and after a strenuous exercise, with the results in the following table. (a) Test if exercise changes the level of lactic acid in blood. Use significance level α=0.01. (b) Find a 95% CI for the mean change in the blood lactose level.
PAIRED t-TEST: lactic acid example contd. Solution. Take d=“After level” – “before level” of lactic acid. Data for d: 18, 4, 17, 22, 23, 17, 5, 10, 7, 1. Sample stats: STEP1.Ho: μd = 0 vs Ha: μd ≠ 0 STEP 2. Test statistic: STEP 3. Critical value? df=n-1=9, tα/2 =t0.005=3.69. STEP 4. DECISION: t = 4.93 > 3.69 = t0.005 , so reject Ho. STEP 5. Exercise changes lactic acid level.
Example contd. (b) Find a 95% CI for the mean change in the blood lactose level. It is the familiar formula for the 95% CI for the mean, this time mean difference μd. Need percentile from the t distribution with n-1 degrees of freedom. n=10, n-1=9, α=0.05, so tα/2 =t0.025=2.262, so the 95% CI for μd is:
Lactic acid example in MINITAB: data set lactic-acid.MPJ Paired T-Test and Confidence Interval Paired T for before - after N Mean StDev SE Mean before 10 15.50 2.37 0.75 after 10 27.90 8.17 2.58 Difference 10 -12.40 7.95 2.51 95% CI for mean difference: (-18.08, -6.72) T-Test of mean difference = 0 (vs not = 0): T-Value = -4.93 P-Value = 0.001 Ho Ha Conclusion: Reject Ho, lactic acid level changes after exercise. Note: CI for “Before –after”