Download
1 / 12
120 likes | 132 Views
CHAPTER 10 Comparing Two Populations or Groups. 10.2 Comparing Two Means. Introduction. What if we want to compare the mean of some quantitative variable for the individuals in Population 1 and Population 2?

E N D
CHAPTER 10Comparing Two Populations or Groups 10.2 Comparing Two Means
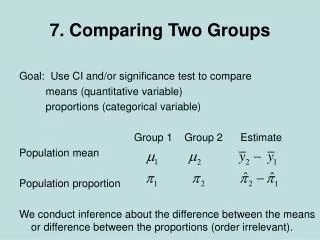
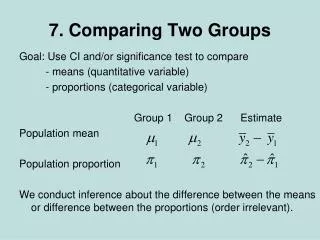
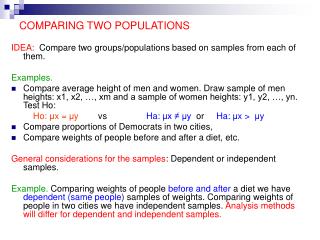
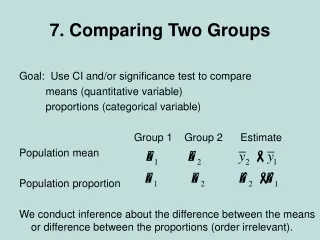
Introduction What if we want to compare the mean of some quantitative variable for the individuals in Population 1 and Population 2? Our parameters of interest are the population means µ1 and µ2. The best approach is to take separate random samples from each population and to compare the sample means. Suppose we want to compare the average effectiveness of two treatments in a completely randomized experiment. We use the mean response in the two groups to make the comparison.
The Sampling Distribution of a Difference Between Two Means The Sampling Distribution of the Difference Between Sample Means Choose an SRS of size n1from Population 1 with mean µ1and standard deviation σ1 and an independent SRS of size n2from Population 2 with mean µ2and standard deviation σ2.
The Two-Sample t Statistic Conditions for Performing Inference About µ1 - µ2 • Random: The data come from two independent random samples or from two groups in a randomized experiment. • 10%: When sampling without replacement, check that • n1 ≤ (1/10)N1and n2 ≤ (1/10)N2. • Normal/Large Sample: Both population distributions (or the true distributions of responses to the two treatments) are Normal or both sample sizes are large (n1 ≥ 30 and n2 ≥ 30). If either population (treatment) distribution has unknown shape and the corresponding sample size is less than 30, use a graph of the sample data to assess the Normality of the population (treatment) distribution. Do not use two-sample t procedures if the graph shows strong skewness or outliers.
Confidence Intervals for µ1 – µ2 Two-Sample t Interval for a Difference Between Two Means
Significance Tests for µ1 – µ2 Two-Sample t Test for the Difference Between Two Means
Using Two-Sample t Procedures Wisely • In planning a two-sample study, choose equal sample sizes if you can. • Do not use “pooled” two-sample t procedures! • We are safe using two-sample t procedures for comparing two means in a randomized experiment. • Do not use two-sample t procedures on paired data! • Beware of making inferences in the absence of randomization. The results may not be generalized to the larger population of interest.