Download
1 / 40
400 likes | 562 Views
Capitalizing on mid-infrared to improve nutritional and environmental quality of milk. H. Soyeurt *,§ , F. Dehareng ** , N. Gengler * , and P. Dardenne **. * Animal Science Unit, Gembloux Agro-Bio Tech, University of Liège, 5030 Gembloux, Belgium

E N D
Capitalizing on mid-infrared to improve nutritional and environmental quality of milk H. Soyeurt*,§ , F. Dehareng**, N. Gengler*, and P. Dardenne** * Animal Science Unit, Gembloux Agro-Bio Tech, University of Liège, 5030 Gembloux, Belgium § National Funds for Scientific Research, 1000 Brussels, Belgium ** Walloon Agricultural Research Centre, Valorisation of Agricultural Products Department, 5030 Gembloux, Belgium
Introduction • Changes of consumer’s perception • Improvement of the nutritional qualityof food • Limitation of the environmental impactof food production and consumption • Milk quality can be improved: • Nutritional quality:E.g., unsaturated fatty acids, calcium, lactoferrin • Environmental quality:E.g., milk production linked to urea, to methane
Introduction • Acquisition of phenotypes needed! • Development of practical tools: • Cheap: to be used on a large scale • Robust: to adapt to different breeds, sampling methods and dates… • Fast: more and more cows/farm • Reliable • Use of mid-infrared spectrometry(MIR) on milk promising technology
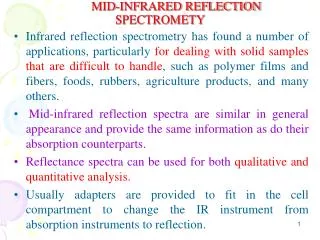
Figure 1 : Electromagnetic spectra (Foss, 2012) MIR spectrometry • Electromagnetic radiation • Ranged between 1,000 and 5,000 cm-1 • Used routinely by milk laboratories to quantify major milk components: • Fat, protein, lactose, urea… • But: currently under-utilized technology
MIR spectrometry Milk samples (milk payment, milk recording) Every 2 or 3 days Bulk milk samples Managed by dairy companies
MIR spectrometry Milk samples (milk payment, milk recording) Regularly (mostly 4 or 6 weeks) Individual cows Managed by milk recording organizations
MIR spectrometry (Foss, 2008) MIR analysis Milk samples (milk payment, milk recording)
MIR spectrometry (Foss, 2008) MIR analysis Milk samples (milk payment, milk recording) Raw data = MIR spectra
MIR spectrometry (Foss, 2008) MIR analysis Milk samples (milk payment, milk recording) Quantification: fat protein lactose … Calibration equations Raw data = MIR spectra
MIR spectrometry (Foss, 2008) (Foss, 2008) MIR analysis MIR analysis Milk samples (milk payment, milk recording) Quantification: fat protein lactose … Quantification: fat protein lactose … Traditional data flow (no MIR spectra stored)
MIR spectrometry (Foss, 2008) MIR analysis Milk samples (milk payment, milk recording) New components require new equations Quantification: fat protein lactose … Calibration equations Stored MIR spectra
MIR calibration equations: Nutritional quality • Milk fatty acid (FA) equations: • First equations developed in 2005 • Improved through international collaborations: • Belgium, France, Germany, Ireland, UK, Luxembourg • Multiple breeds, countries and production systems
Accuracy of fatty acidscalibration equations Calibration equations were developed from at least 1,600 milk samples
Accuracy of fatty acidscalibration equations R² ≥ 0.80for all FA except for C14:1, C16:1cis, the individual polyunsaturated FA and the group of polyunsaturated FA Calibration equations were developed from at least 1,600 milk samples
Accuracy of fatty acidscalibration equations R² ≥ 0.80for all FA except for C14:1, C16:1cis, the individual polyunsaturated FA and the group of polyunsaturated FA In conclusion, 18 FA MIR equations could be used in practice Calibration equations were developed from at least 1,600 milk samples
MIR calibration equations: Nutritional quality • Milk fatty acid (FA) equations: • First equations developed in 2005 • Improved through international collaborations: • Belgium, France, Germany, Ireland, UK, and Luxembourg • Multiple breeds, countries and production systems • Milk mineralequations: • First equations developed in 2006 • Improved through international collaborations: • Belgium, France, Germany, and Luxembourg
Accuracy of milk minerals calibration equations Calibration equations were developed from at least 465 milk samples
Accuracy of milk minerals calibration equations • R² ≥ 0.80for Na and Ca potential practical uses • Ca: milk fever, osteoporosis • Na: indicator of mastitis Calibration equations were developed from at least 465 milk samples
MIR calibration equations: Nutritional quality • Milk fatty acid (FA) equations: • First equations developed in 2005 • Improved through international collaborations: • Belgium, France, Germany, Ireland, UK, and Luxembourg • Multiple breeds, countries and production systems • Milk mineral equations: • First equations developed in 2006 • Improved through international collaborations: • Belgium, France, Germany, and Luxembourg • Lactoferrin equations: • Cooperative effort of Belgium, Ireland and UK
Lactoferrin • Glycoprotein present naturally in milk • Involved in the immune system • Interests: • Potential indicator of mastitis • Help to maintain a good immune system in Humans • R² of internal validation = 0.71 MIR indicator of lactoferrin
Lactoferrin • Glycoprotein present naturally in milk • Involved in the immune system • Interests: • Potential indicator of mastitis • Help to maintain a good immune system in Humans • R² of internal validation = 0.71 R² < 0.80MIR indicator of lactoferrin Improves slightly detection of mastitiscompared to just using somatic cell score
MIR calibration equations: Environmental quality • Methane reference trait • Measured by the SF6 method • Indirect link with milk FA (predicted by MIR)Direct prediction of methane by MIR ? • If possible can be used for: • Inventory of methane emissions • Environmental labeling of food • Reducing methane produced by individual cows
Methane R² of internal validation (196 samples) = 0.72
Methane An indicator of methane can be predicted by MIR
Conclusions • MIR spectrometry under-utilizedin practice • Potential to predictnew traitswith real economic and societal interests • However, this is not always easy…
Not so easy… • Developed MIR equations • Must be validated on used dairy population(even if the equation was built internationally) • Because of differences in breeds and production systems affecting prediction • Adding specific samples needed! • Variability of calibration set • Adaptation of equations to new population • Therefore: general robustness of equations
Not so easy… • If spectral data was recorded, should beeasy to implement new equationsin milk laboratories? • However • Specific spectrometers were used to develop given calibrations • To avoid any additional bias all thespectral dataneed to be standardizedwith those used in calibration
Not so easy… • Accuracy of the MIR predictionmust be tested regularlybased on reference samples • Creation of reference samples needs • Reliable reference values (traits to predict from MIR), potential difficult to obtain (e.g., methane) • Conservation and distribution of fresh milk samples (needed to be analyzed by MIR) • Many logistical challenges
Part II:Capitalizing on MIR traits for dairy cattle breedingand management
MIR spectral databases • Creation ofspectral databasesrelated to milk recording needed • Already in Walloon Region of Belgium and in Luxembourg • In August 2012, available spectral records: • 2,305,838 test-day records from Walloon Region of Belgium • 1,262,190 test-day records from Luxembourg • This allows • Large scale studies of genetic and phenotypic variability
MIR spectral databases • Creation ofspectral databasesrelated to milk recording needed • Already in Walloon Region of Belgium and in Luxembourg • In August 2012, available spectral records: • 2,305,838 test-day records from Walloon Region of Belgium • 1,262,190 test-day records from Luxembourg • This allows • Large scale studies of genetic and phenotypic variability Development of selection and management tools
Capitalizing for breeding Daily h² for saturated FA = 0.59 Daily h² for monounsaturated FA = 0.26 Daily h² for calcium = 0.50 Daily h² for sodium = 0.34 Daily h² for magnesium = 0.52 Daily h² for potassium = 0.48 Daily h² for phosphorus = 0.55 Soyeurt et al. (2012), EAAP Daily h² for lactoferrin = 0.35 Previous estimates: 0.20 – 0.44 Soyeurt et al. (2012), EAAP Bastin et al. (2012), EAAP First results obtained by Purna Badhra Kandel (ITN Marie Curie, GreenHouseMilk project)
Capitalizing for breeding Available data Genetic variation Genetic evaluations
Capitalizing for breeding Available data Genetic variation Genetic evaluations Genotypes Genomic evaluations
Capitalizing for breeding • Potentially useful also for other countrieswhich have not access to these phenotypes… • Different opportunities: • Collaboration in genomic prediction • Sharing of phenotypes and genotypes up tojoint evaluations • Creating and capitalizing on local prediction equations • Collaboration in genome wide association studies • Combining station and MIR predicted field data (e.g., bull EBVs) • Example for fatty acids done in RobustMilk project,more details given by Catherine Bastin (EAAP, 2012)
Capitalizing for management • Novel MIR traits not onlyinteresting for breeding • Thanks to available large milk recording databases: • Study the phenotypic variability of MIR new traits • Define best practices, potentially useful: • To mitigate the CH4 emissions • To decrease the release of urea in milk • To improve the FA content of milk • New step: direct use of MIR variability • OptiMIR project (www.optimir.eu)
Conclusion • MIR interesting for breeding purposes However ….
However … • Position of novel MIR traits in future breeding(and production) goals still uncertain • Need to discuss with all stakeholdersto know what will be the future of dairy products and production • Better knowledge of relationships of these traits with other traits having economical and societal interests(e.g., production, health and fertility, longevity) needed • Therefore: • Definition of new breeding programsandmanagement objectivestaking into account all these aspects needed
Collaborations • If you are interested in joining the consortium to improve the MIR equations: hsoyeurt@ulg.ac.be • If you are interested in sharing phenotypes and genotypes: nicolas.gengler@ulg.ac.be Thank you for your attention