Phase Changes
230 likes | 495 Views
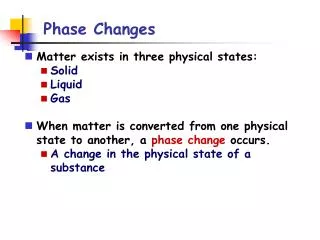
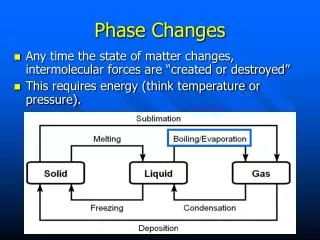
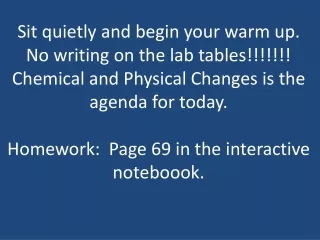
Phase Changes. Surface molecules are only attracted inwards towards the bulk molecules. Sublimation : solid gas. Vaporization : liquid gas. Melting or fusion : solid liquid. Deposition : gas solid. Condensation : gas liquid. Freezing : liquid solid.

Phase Changes
E N D
Presentation Transcript
Phase Changes • Surface molecules are only attracted inwards towards the bulk molecules. • Sublimation: solid gas. • Vaporization: liquid gas. • Melting or fusion: solid liquid. • Deposition: gas solid. • Condensation: gas liquid. • Freezing: liquid solid. Energy Changes Accompanying Phase Changes • Energy change of the system for the above processes are: Chapter 11
Intermolecular Forces Bulk and Surface Chapter 11
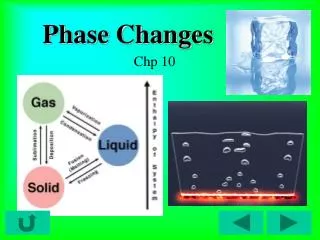
Phase Changes Energy Changes Accompanying Phase Changes • Sublimation: Hsub > 0 (endothermic). • Vaporization: Hvap > 0 (endothermic). • Melting or Fusion: Hfus > 0 (endothermic). • Deposition: Hdep < 0 (exothermic). • Condensation: Hcon < 0 (exothermic). • Freezing: Hfre < 0 (exothermic). • Generally heat of fusion (enthalpy of fusion) is less than heat of vaporization: • it takes more energy to completely separate molecules, than partially separate them. Chapter 11
Phase Changes Energy Changes Accompanying Phase Changes • All phase changes are possible under the right conditions (e.g. water sublimes when snow disappears without forming puddles). • The sequence heat solid melt heat liquid boil heat gas is endothermic. • The sequence cool gas condense cool liquid freeze cool solid is exothermic. Chapter 11
Phase Changes Energy Changes Accompanying Phase Changes Chapter 11
Phase Changes Heating Curves • Plot of temperature change versus heat added is a heating curve. • During a phase change, adding heat causes no temperature change. • These points are used to calculate Hfus and Hvap. • Supercooling: When a liquid is cooled below its melting point and it still remains a liquid. • Achieved by keeping the temperature low and increasing kinetic energy to break intermolecular forces. Chapter 11
Phase Changes Heating Curves Chapter 11
Heating Curve Illustrated Chapter 11
Phase Changes Critical Temperature and Pressure • Gases liquefied by increasing pressure at some temperature. • Critical temperature: the minimum temperature for liquefaction of a gas using pressure. • Critical pressure: pressure required for liquefaction. Chapter 11
Critical Temperature, Tc Chapter 11
Transition to Supercritical CO2 Chapter 11
Vapor Pressure Explaining Vapor Pressure on the Molecular Level • Some of the molecules on the surface of a liquid have enough energy to escape the attraction of the bulk liquid. • These molecules move into the gas phase. • As the number of molecules in the gas phase increases, some of the gas phase molecules strike the surface and return to the liquid. • After some time the pressure of the gas will be constant at the vapor pressure. Chapter 11
Gas-Liquid Equilibration Chapter 11
Vapor Pressure Explaining Vapor Pressure on the Molecular Level • Dynamic Equilibrium: the point when as many molecules escape the surface as strike the surface. • Vapor pressure is the pressure exerted when the liquid and vapor are in dynamic equilibrium. Chapter 11
Vapor Pressure Volatility, Vapor Pressure, and Temperature • If equilibrium is never established then the liquid evaporates. • Volatile substances evaporate rapidly. • The higher the temperature, the higher the average kinetic energy, the faster the liquid evaporates. Chapter 11
Liquid Evaporates when no Equilibrium is Established Chapter 11
Vapor Pressure Volatility, Vapor Pressure, and Temperature Chapter 11
Vapor Pressure Vapor Pressure and Boiling Point • Liquids boil when the external pressure equals the vapor pressure. • Temperature of boiling point increases as pressure increases. • Two ways to get a liquid to boil: increase temperature or decrease pressure. • Pressure cookers operate at high pressure. At high pressure the boiling point of water is higher than at 1 atm. Therefore, there is a higher temperature at which the food is cooked, reducing the cooking time required. • Normal boiling point is the boiling point at 760 mmHg (1 atm). Chapter 11
Phase Diagrams • Phase diagram: plot of pressure vs. Temperature summarizing all equilibria between phases. • Given a temperature and pressure, phase diagrams tell us which phase will exist. • Features of a phase diagram: • Triple point: temperature and pressure at which all three phases are in equilibrium. • Vapor-pressure curve: generally as pressure increases, temperature increases. • Critical point: critical temperature and pressure for the gas. • Melting point curve: as pressure increases, the solid phase is favored if the solid is more dense than the liquid. • Normal melting point: melting point at 1 atm. Chapter 11
Phase Diagrams • Any temperature and pressure combination not on a curve represents a single phase. Chapter 11
Phase Diagrams The Phase Diagrams of H2O and CO2 • Water: • The melting point curve slopes to the left because ice is less dense than water. • Triple point occurs at 0.0098C and 4.58 mmHg. • Normal melting (freezing) point is 0C. • Normal boiling point is 100C. • Critical point is 374C and 218 atm. • Carbon Dioxide: • Triple point occurs at -56.4C and 5.11 atm. • Normal sublimation point is -78.5C. (At 1 atm CO2 sublimes it does not melt.) • Critical point occurs at 31.1C and 73 atm. Chapter 11
Phase Diagrams The Phase Diagrams of H2O and CO2 Chapter 11