Download
1 / 29
310 likes | 336 Views
Phase Changes. Energy Changes Associated with Changes of State. Heat of Fusion: Energy required to change a solid at its melting point to a liquid. Energy Changes Associated with Changes of State. Heat of Vaporization: Energy required to change a liquid at its boiling point to a gas.

E N D
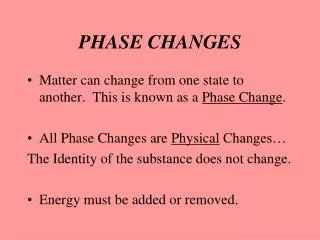
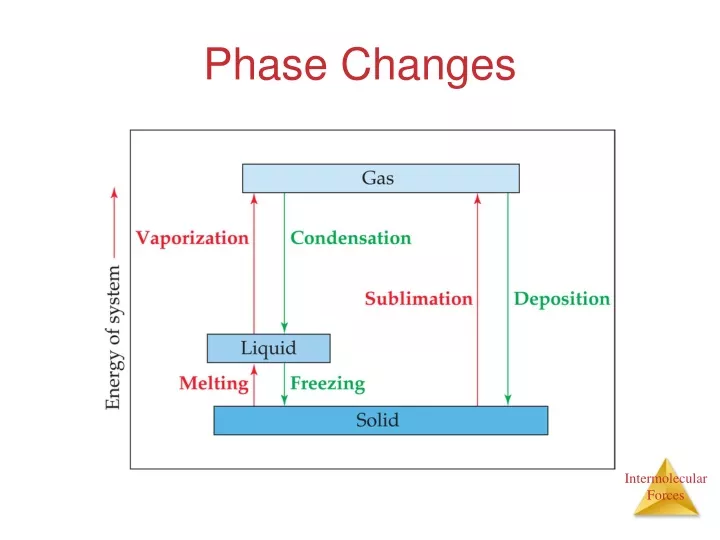
Energy Changes Associated with Changes of State • Heat of Fusion: Energy required to change a solid at its melting point to a liquid.
Energy Changes Associated with Changes of State • Heat of Vaporization: Energy required to change a liquid at its boiling point to a gas.
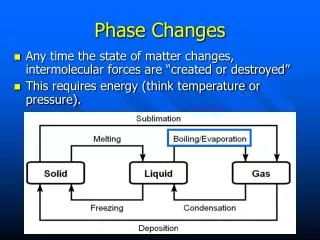
Energy Changes Associated with Changes of State • The heat added to the system at the melting and boiling points goes into pulling the molecules farther apart from each other. • The temperature of the substance does not rise during the phase change.
Vapor Pressure • At any temperature, some molecules in a liquid have enough energy to escape. • As the temperature rises, the fraction of molecules that have enough energy to escape increases.
Vapor Pressure As more molecules escape the liquid, the pressure they exert increases.
Vapor Pressure The liquid and vapor reach a state of dynamic equilibrium: liquid molecules evaporate and vapor molecules condense at the same rate.
Vapor Pressure • The boiling point of a liquid is the temperature at which its vapor pressure equals atmospheric pressure. • The normal boiling point is the temperature at which its vapor pressure is 760 torr.
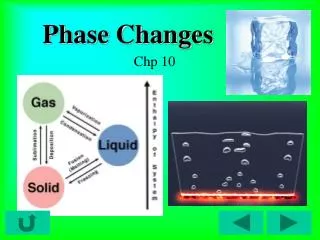
Phase Diagrams Phase diagrams display the state of a substance at various pressures and temperatures and the places where equilibria exist between phases.
Phase Diagrams • The AB line is the liquid-vapor interface. • It starts at the triple point (A), the point at which all three states are in equilibrium.
Phase Diagrams It ends at the critical point (B); above this critical temperature and critical pressure the liquid and vapor are indistinguishable from each other.
Phase Diagrams Each point along this line is the boiling point of the substance at that pressure.
Phase Diagrams • The AD line is the interface between liquid and solid. • The melting point at each pressure can be found along this line.
Phase Diagrams • Below A the substance cannot exist in the liquid state. • Along the AC line the solid and gas phases are in equilibrium; the sublimation point at each pressure is along this line.
Phase Diagram of Water • Note the high critical temperature and critical pressure: • These are due to the strong van der Waals forces between water molecules.
Phase Diagram of Water • The slope of the solid–liquid line is negative. • This means that as the pressure is increased at a temperature just below the melting point, water goes from a solid to a liquid.
Phase Diagram of Carbon Dioxide Carbon dioxide cannot exist in the liquid state at pressures below 5.11 atm; CO2 sublimes at normal pressures.
Phase Diagram of Carbon Dioxide The low critical temperature and critical pressure for CO2 make supercritical CO2 a good solvent for extracting nonpolar substances (such as caffeine).
Solids • We can think of solids as falling into two groups: • Crystalline—particles are in highly ordered arrangement.
Solids • Amorphous—no particular order in the arrangement of particles.
Attractions in Ionic Crystals In ionic crystals, ions pack themselves so as to maximize the attractions and minimize repulsions between the ions.
Crystalline Solids Because of the order in a crystal, we can focus on the repeating pattern of arrangement called the unit cell.
Crystalline Solids There are several types of basic arrangements in crystals, such as the ones shown above.
Crystalline Solids We can determine the empirical formula of an ionic solid by determining how many ions of each element fall within the unit cell.
Ionic Solids What are the empirical formulas for these compounds? (a) Green: chlorine; Gray: cesium (b) Yellow: sulfur; Gray: zinc (c) Green: calcium; Gray: fluorine (a) (b) (c) CsCl ZnS CaF2
Covalent-Network andMolecular Solids • Diamonds are an example of a covalent-network solid in which atoms are covalently bonded to each other. • They tend to be hard and have high melting points.
Covalent-Network andMolecular Solids • Graphite is an example of a molecular solid in which atoms are held together with van der Waals forces. • They tend to be softer and have lower melting points.
Metallic Solids • Metals are not covalently bonded, but the attractions between atoms are too strong to be van der Waals forces. • In metals, valence electrons are delocalized throughout the solid.