Download
1 / 24
240 likes | 377 Views
Improving the Estimates of the U.S. Young Adult Population. Jason Devine Population Division. Applied Demography Conference San Antonio, Texas January 8-10, 2014. Estimates Evaluations (E2 ): Research, Results, and Direction

E N D
Improving the Estimates of the U.S. Young Adult Population Jason Devine Population Division Applied Demography Conference San Antonio, Texas January 8-10, 2014
Estimates Evaluations (E2): Research, Results, and Direction Results from our evaluation of our total population estimates were presented at a Census Bureau conference held on March 30, 2012 http://www.census.gov/popest/research/eval-estimates/eval-est.html
Young adult ages have the largest county-level differences on average from the census counts. We wanted to look first at previously identified methodological issues. Currently use a “College Fix” to account for unmeasured college-age migration. The young adult population is very mobile, moves for a variety of reasons, and their movement impacts many counties. Why Focus on Young Adult Migration?
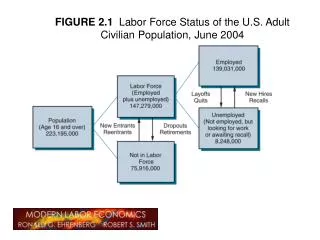
National level Cohort-component method† P2 = P1 + Births - Deaths + NIM NIM = Net International Migration • State and county level Cohort-component method† P2 = P1 + Births - Deaths + NIM + DM DM = Domestic migration (controlled to the national estimates) † Frequently referred to as the Administrative Record (ADREC) method because of our reliance on administrative record data for the components of change. Estimates Methodology
How Do We Estimate County-to-County Migration? Step 1: Compare two years of IRS data to identify those who have moved to another county. Step 2: Use a secure process to match IRS records to 2010 Census data to obtain characteristics of movers. Step 3: Use movers and non-movers to develop in- and out-migration rates and proportions to apply to the population.
28 18 Hypothetical Example College County • No Measured Migration • No Deaths • Constant Level of Births
What is the “College Fix”? Implemented in 2005 to address unrealistic changes in the age distribution of college counties. These changes were due to incomplete IRS coverage of college-age movers. Accounts for unmeasured migration by not aging forward a county’s enrolled college-age household population. Indirectly impacts non-college fix counties through the application of anational control. Was initially applied to all counties; we began to refine the counties included in 2009.
Mean Absolute Percent Error: MAPE Represents the average error across cases regardless of sign Mean Algebraic Percent Error: MALPE Represents the average error across cases with the sign
Mean Absolute Percent Error: MAPE The MAPE for the 2010 County-Level Population Estimates was: 3.10 Mean Algebraic Percent Error: MALPE The MALPE for the 2010 county-level population estimates was: -1.59
County-Level MAPEs and MALPEs Ages 0-85 by Single-Year-of-Age: 2010*
County-Level MAPEs and MALPEs Ages 18-39 by Single-Year-of-Age: 2010*
County-Level MAPEs and MALPEs for College Fix Counties Ages 18-39 by Single-Year-of-Age: 2010
County-Level MAPEs and MALPEs for College Fix Counties Ages 18-39 by Single-Year-of-Age: 2010*
County-Level MAPEs and MALPEs for College Fix Counties Ages 18-39 by Single-Year-of-Age: 2010
Does the College Fix Improve the Population Estimates? Yes. Reduces the average error and bias by age for both college and non-college counties. Changes a large negative bias in the estimates for the college ages in College Fix counties to a smaller positive bias. Reduces the average error of 30 to 35 year olds in college counties but turns the bias from positive to negative.
How Does the College Fix Impact Individual Counties? Reduces the differences in the college ages. Changes what would have been an underestimate of the college ages to an overestimate. Reduces the differences seen in ages 28 to 35 (the college ages plus 10 years). Changes what would have been an overestimate of ages 28 to 35 to an underestimate.
Centre County, Pennsylvania Pennsylvania State University
Alachua County, Florida University of Florida
Brazos County, Texas Texas A&M
Bexar County, Texas Not Included as a College Fix County
Utah County, Utah Brigham Young University
Young Adult Migration includes more than just college students: Labor migration, Military, International migrants, Others. Future Research
Need a better understanding of how well our IRS-based methodology measures young adult migration. Looking to other sources such as the American Community Survey to measure the number of young adults that move to another county. Focus is on ages 18 to 29. We continue to work to improve our current College Fix. Future Research
Jason Devine jason.e.devine@census.gov Population Division U.S. Census Bureau Contact