Download
1 / 25
260 likes | 439 Views
Coverage Bias in Traditional Telephone Surveys of Low-Income and Young Adults. Stephen Blumberg sblumberg@cdc.gov Julian Luke jluke@cdc.gov. Centers for Disease Control and Prevention National Center for Health Statistics. Percentage of U.S. Households Without Landline Telephones.

E N D
Coverage Bias in Traditional Telephone Surveys of Low-Income and Young Adults Stephen Blumberg sblumberg@cdc.gov Julian Luke jluke@cdc.gov Centers for Disease Control and Prevention National Center for Health Statistics
Percentage of U.S. HouseholdsWithout Landline Telephones • Based on National Health Interview Survey data 15.8% of households have only wireless telephones
Prevalence of Wireless-Only Adultsby Age 34.5% of 25-29 30.6% of 18-24 15.5% of 30-44 8.0% of 45-64 2.2% of 65+
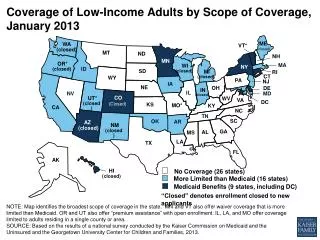
Prevalence of Wireless-Only Adultsby Household Poverty Status 27.4% of adults in poverty 20.8% of adults near poverty 11.9% of higher income adults
Goals of the POQ Article • Biases for subgroups of the population may not be adequately reflected in observed biases for the overall population • Examined the potential bias that may result when health surveys about young adults and low-income adults exclude households without landline telephones
National Health Interview Survey • In-person survey of the civilian noninstitutionalized U.S. population • Annual household-level response rates are very high (86-92%) • Includes questions on residential telephone numbers to permit recontact of participants • 2003: Added questions on working cellular telephones • 2007: Added questions on relative frequency of calls received on landlines and cell phones
Coverage Bias • Two factors determine the degree of coverage bias due to telephone ownership in a telephone survey: • The percentage of persons without landline telephones in the population of interest • The magnitude of the difference between persons with and without landline telephones for the variable of interest
Health-related behaviors 5+ alcoholic drinks in one day (past year) Smoking (current) Leisure-time physical activity (regularly) Health status Excellent or very good health status Serious psychological distress (past 30 days) Obesity Asthma episode (past year) Diabetes (ever diagnosed) Health care service use Has a usual place to go for medical care Received influenza vaccine (past year) Tested for HIV (ever) Financial barrier to needed care (past year) Uninsured (current) Health Characteristics Examined For these 13 estimates, preliminary weighted data from July – December 2007 were produced by the NHIS Early Release Program.
Percent of U.S. Adults with Various Health Characteristics, by Phone Status July – December 2007
Percent of U.S. Adults with Various Health Characteristics, by Phone Status July – December 2007
Prevalence of Young Adults and Low-Income AdultsAmong Wireless-Only Adults • Half (49%) of all wireless-only adults are less than 30 years of age. • Approximately 40% of all wireless-only adults are living in households with income below 200% of the Federal Poverty Level.
Percent of Young Adults with Various Health Characteristics, by Phone Status January – December 2007
Percent of Young Adultswith Various Health Characteristics, by Phone Status January – December 2007
Percent of Young Adultswith Various Health Characteristics, by Phone Status January – December 2007
Potential Bias (in Percentage Points) if an RDD Survey Only Includes Landlines January – December 2007
Potential Bias (in Percentage Points) if an RDD Survey Only Includes Landlines January – December 2007
Potential Bias (in Percentage Points) if an RDD Survey Only Includes Landlines January – December 2007
Conclusions • The increase in the prevalence of wireless-only adults has led to nonnegligible coverage biases in landline telephone surveys even after adjusting for demographic differences • Carefully developed sample weights, using multiple demographic control totals, can attenuate the magnitude of bias • But can other statistical adjustments reduce the bias even further?
Percent Distribution of Household Telephone Status for Adults, July-December 2007 Phoneless: 1.9% Unknown: 1.3% Wireless Only: 14.5% Landline Only: 19.1% Wireless Mostly: 14.0% Landline with Some Wireless: 49.2%
Percent of U.S. Adults with Various Health Characteristics, by Phone Status NHIS July - December 2007
Brick, Waksberg, & Keeter (1996) Households with interruptions in service are similar to… Landline Only Landline and Wireless Wireless Only Phoneless
Possible Statistical Adjustment Households with interruptions in service are similar to… Wireless-mostly HHs are similar to… Landline Only Landline and Wireless Wireless Only Phoneless
Future Steps • Wireless-mostly adults are similar in many respects to wireless-only adults • But…Are wireless-mostly adults who will respond to a landline survey similar to wireless-only adults? • 14.5% of adults were wireless-only in July-December 2007 • But…What percent of adults in your survey’s subnational population are wireless-only?