Download

1 / 63
650 likes | 965 Views
An Introduction to Risk and Return: History of Financial Market Returns. Chapter 7. Calculating the Realized Return from an Investment. Realized return or cash return measures the gain or loss on an investment. Calculating the Realized Return from an Investment (cont.).

E N D
An Introduction to Risk and Return: History of Financial Market Returns Chapter 7
Calculating the Realized Return from an Investment Realized return or cash return measures the gain or loss on an investment.
Calculating the Realized Return from an Investment (cont.) Example 1: You invested in 1 share of Apple (AAPL) for $95 and sold a year later for $200. The company did not pay any dividend during that period. What will be the cash return on this investment?
Calculating the Realized Return from an Investment (cont.) Cash Return = $200 + 0 - $95 = $105
Calculating the Realized Return from an Investment (cont.) We can also calculate the rate of return as a percentage. It is simply the cash return divided by the beginning stock price.
Calculating the Realized Return from an Investment (cont.) Example 2: You invested in 1 share of share Apple (AAPL) for $95 and sold a year later for $200. The company did not pay any dividend during that period. What will be the rate of return on this investment?
Calculating the Realized Return from an Investment (cont.) Rate of Return = ($200 + 0 - $95) ÷ 95 = 110.53%
Calculating the Realized Return from an Investment (cont.) Returns from investing in common stocks can be positive or negative! Past performance is not an indicator of future performance. In general, we expect to receive higher returns for assuming higher risk.
Calculating the Expected Return from an Investment Expected return is what you expect to earn from an investment in the future. It is estimated as the average of the possible returns, where each possible return is weighted by the probability that it occurs.
Calculating the Expected Return from an Investment (cont.) Expected Return = (-10%×0.2) + (12%×0.3) + (22%×0.5) = 12.6%
Measuring Risk In the example on Table 7-2, the expected return is 12.6%; however, the return could range from -10% to +22%. This variability in returns can be quantified by computing the Variance or Standard Deviation in investment returns.
Measuring Risk (cont.) Standard deviation is given by square root of the variance and is more commonly used.
Calculating the Variance and Standard Deviation of the Rate of Return on an Investment Let us compare two possible investment alternatives: (1) U.S. Treasury Bill – Treasury bill is a short-term debt obligation of the U.S. Government. Matures in one year and promises to pay an annual return of 5%. The U.S. Treasury bill is considered risk-free as there is no risk of default on the promised payments. (2) Common stock of the Ace Publishing Company – an investment in common stock will be a risky investment.
Calculating the Variance and Standard Deviation of the Rate of Return on an Investment (cont.) The probability distribution of an investment’s return contains all possible rates of return from the investment along with the associated probabilities for each outcome. Figure 7-1 contains a probability distribution for U.S. Treasury bill and Ace Publishing Company common stock.
Calculating the Variance and Standard Deviation of the Rate of Return on an Investment (cont.) The probability distribution for Treasury bill is a single spike at 5% rate of return indicating that there is 100% probability that you will earn 5% rate of return. The probability distribution for Ace Publishing company stock includes returns ranging from -10% to 40% suggesting the stock is a risky investment.
Calculating the Variance and Standard Deviation of the Rate of Return on an Investment (cont.) Using equation 7-3, we can calculate the expected return on the stock to be 15% while the expected return on Treasury bill is always 5%. Does the higher return of stock make it a better investment? Not necessarily, we also need to know the risk in both the investments.
Calculating the Variance and Standard Deviation of the Rate of Return on an Investment (cont.) We can measure the risk of an investment by computing the variance as follows:
Calculating the Variance and Standard Deviation of the Rate of Return on an Investment (cont.) The publishing company stock offers a higher expected return but also entails more risk as measured by standard deviation. An investor’s choice of a specific investment will be determined by their attitude toward risk.
Checkpoint 7.1 Evaluating an Investment’s Return and Risk Clarion Investment Advisors is evaluating the distribution of returns for a new stock investment and has come up with five possible rates of return for the coming year. Their associated probabilities are as follows: a. What expected rate of return might they expect to realize from the investment? b. What is the risk of the investment as measured using the standard deviation of possible future rates of return?
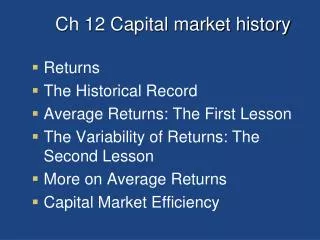
A Brief History of the Financial Markets Investors have historically earned higher rates of return on riskier investments. However, having a higher expected rate of return simply means that investors “expect” to realize a higher return. Higher return is not guaranteed.
U.S. Financial Markets — Domestic Investment Returns (cont.)
U.S. Financial Markets — Domestic Investment Returns (cont.) We observe a clear relationship between risk and return. Small stocks have the highest annual return but higher returns are associated with much greater risk.
Lessons Learned from Historical Returns in the Financial Market Lesson #1: Riskier investments have historically realized higher returns. The difference between the return on riskier stock investments and government securities is called the equity risk premium. For example, the equity risk premium is 6% for small stocks over government bonds (11.7% - 5.7% = 6%).
Lessons Learned from Historical Returns in the Financial Market (cont.) Lesson #2: The historical returns of the higher-risk investment classes have higher standard deviations. For example, small stocks had a standard deviation of 34.1% while the standard deviation of treasury bill was only 0.9%.
U.S. Stocks versus Other Categories of Investments (cont.) We can observe from Figure 7-3 that U.S. stocks had the highest annual return of 10.7% while gold had the lowest return of 1.8%.
Global Financial Markets – International Investing (cont.) We observe that Pacific stocks had the highest volatility with returns ranging from a high of 107.5% to a low of -36.2%. In contrast, the US stocks had the least volatility with returns ranging from a high of 37.6% and a low of -37.0%.
Global Financial Markets – International Investing (cont.) An emerging market is one located in a country with low-to-middle per capita income (such as China, India). These countries represent about 80% of the world’s population and about 20% of the world’s economies. A developed country is sometimes referred to as an industrialized country Has a highly sophisticated and well developed economy.
Global Financial Markets – International Investing (cont.) We observe from figure 7-5 that the average rates of return from investing in emerging markets were generally higher than those earned in developed countries group. However, emerging market also had much more volatile returns over the period 1988-2008.
Geometric vs. Arithmetic Average Rates of Return Arithmetic average may not always capture the true rate of return realized on an investment. In some cases, geometric or compound average may be a more appropriate measure of return.
Geometric vs. Arithmetic Average Rates of Return (cont.) For example, suppose you bought a stock for $25. After one year, the stock rises to $30 and in the second year, it falls to $15. What was the average return on this investment?
Geometric vs. Arithmetic Average Rates of Return (cont.) The stock earned +20% in the first year and -50% in the second year. Simple average return = (+20%-50%) ÷ 2 = -15%
Geometric vs. Arithmetic Average Rates of Return (cont.) Here, -15% is the simple arithmetic average while -22.54% is the geometric or compound average rate. Which one is the correct indicator of return? It depends on the question being asked.
Geometric vs. Arithmetic Average Rates of Return (cont.) The geometric average rate of return answers the question, “What was the growth rate of your investment?” The arithmetic average rate of return answers the question, “what was the average of the yearly rates of return?
Computing Geometric Average Rate of Return (cont.) Compute the arithmetic and geometric average for the following stock.
Computing Geometric Average Rate of Return (cont.) Arithmetic Average = (40-50) ÷ 2 = -5% Geometric Average = [(1+Ryear1) × (1+Ryear 2)]1/2 - 1 = [(1.4) × (.5)] 1/2 - 1 = -16.33%
Choosing the Right “Average” Both arithmetic average geometric average are important and correct. The following grid provides some guidance as to which average is appropriate and when:
What Determines Stock Prices? In short, stock prices tend to go up when there is good news about future profits, and they go down when there is bad news about future profits. “Fear and Greed”
The Efficient Market Hypothesis The efficient market hypothesis (EMH) states that securities prices accurately reflect future expected cash flows and are based on information available to investors. An efficient market is a market in which all the available information is fully incorporated into the prices of the securities and the returns the investors earn on their investments cannot be predicted.
The Efficient Market Hypothesis (cont.) We can distinguish among three types of efficient market, depending on the degree of efficiency: The Weak-Form Efficient Market Hypothesis The Semi-Strong Form Efficient Market Hypothesis The Strong Form Efficient Market Hypothesis