Download
1 / 27
270 likes | 368 Views
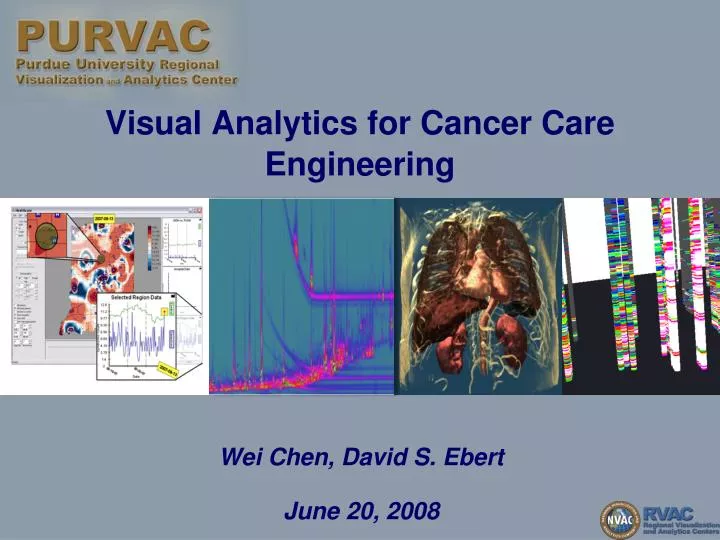
Visual Analytics for Cancer Care Engineering. Wei Chen, David S. Ebert June 20, 2008. Visual Analytics. The science of analytical reasoning facilitated by interactive visual interfaces. 3. 1. 2. Synthesize information and derive insight. Detect the expected and discover the unexpected.

E N D
Visual Analytics for Cancer Care Engineering Wei Chen, David S. Ebert June 20, 2008
Visual Analytics The science of analytical reasoning facilitated by interactive visual interfaces. 3 1 2 Synthesize information and derive insight Detect the expected and discover the unexpected Provide and communicate assessments
Visual Analysis Data Collection Database Analysis/Extraction Visual Mapping Image Schema &Hypothesis Verification Visual Analysis Visual Analysis Visual Analysis Goals • Effectively convey information to the user • Increase the quantity and clarity of the information • Allow interactive visual analysis and exploration
Visual Analytics for Cancer Care Engineering PURVAC: Visual Analytics for Healthcare Monitoring and Management Health InformationExchanges OMICS Data Prevention & Planning Biomarker Detection INPC Patient Demographics Diet Environment Data Integration, Privacy Preservation Statistical & Analytical DataGeospatial AnalysisFactor and Correlative Analysis Statistical Modeling &Scalable Simulations Health & Patient Monitoring Treatment Planning
TADA: Technology Assisted Dietary Assessment (Boushey, Ebert, Delp, Craig, Lutes) • Goal: Provide nutritional information of food consumed by simply taking a picture of the plate of food before and after the meal using a cellphone • Application: Disease dietary assessment, weight loss • Process: Image segmentationVolume estimationNutritional calculation
TADA Overview Garlic bread Pork Rib Extract steak After Meal Before Meal Food intake comparison
Developing an Interactive Visual Analytics Environment – Health Surveillance GUI Interface for SQL queries User selects are for investigation and new analysis is performed Drill down to explore hospital data Look for correlating factors – fever
Initial Data Sets • Patient Information • Patient demographic • Clinic data • Historic data • … • Modeling • Peak identification • Statistical analysis • Correlative analysis • Sample Classification • OMICS Samples • Genomics • Proteomics • Metabolomics • Lipidomics Datasets
Bio-markers Initial Focus Representation Formatting Preprocess Exploration Visualization Preview
2D TIC vs 3D Volumetric Representation + + + + +
Visualization: 3D Volume Visualization Normal template Cancer template
Exploration: 3D Comparative Navigation Comparison Filtering
Visual Analytics for Cancer Care Engineering PURVAC: Visual Analytics for Healthcare Monitoring and Management Health InformationExchanges OMICS Data • Linked Animal-Human Visual Analytics • Integrated temporal, geospatial, multisource, multiscale analytic capability • Systemic biological pandemic, syndromic, chem/bio surveillance, management, and response • Partners: NVAC, Purdue Veterinary Medicine, Indiana Board of Animal Health, Indiana State Department of Health, linkage with Banfield veterinary data (2% of all pet dogs/cats/birds in US) • Example: linked human, livestock, companion animal surveillance for seasonal influenza over the past 2 years • Possible unique detection of seasonal childhood illness • Statistical correlative analysis of pet and human influenza • Example: Did a Mercaptan spill in June 2006 in Fairburn, Ga. cause a public health incident? • No electronic ED data available • Utilize Banfield veterinary records and perform syndromic geospatial temporal visual analytics Prevention & Planning Biomarker Detection INPC Patient Demographics Diet Environment Data Integration, Privacy Preservation Statistical & Analytical DataGeospatial AnalysisFactor and Correlative Analysis Statistical Modeling &Scalable Simulations Health & Patient Monitoring Treatment Planning
Acknowledgements • Lingyan Liu (Department of Chemistry) • Daniel Raftery (Department of Chemistry) • Haiwei Gu (Department of Physics) • Ann Christine Catlin (Rosen Center for Advanced Computing) • Phil Livengood from PURVAC • All project colleagues