Download
1 / 4
40 likes | 116 Views
Nuix protects, informs, and empowers society in the knowledge age.

E N D
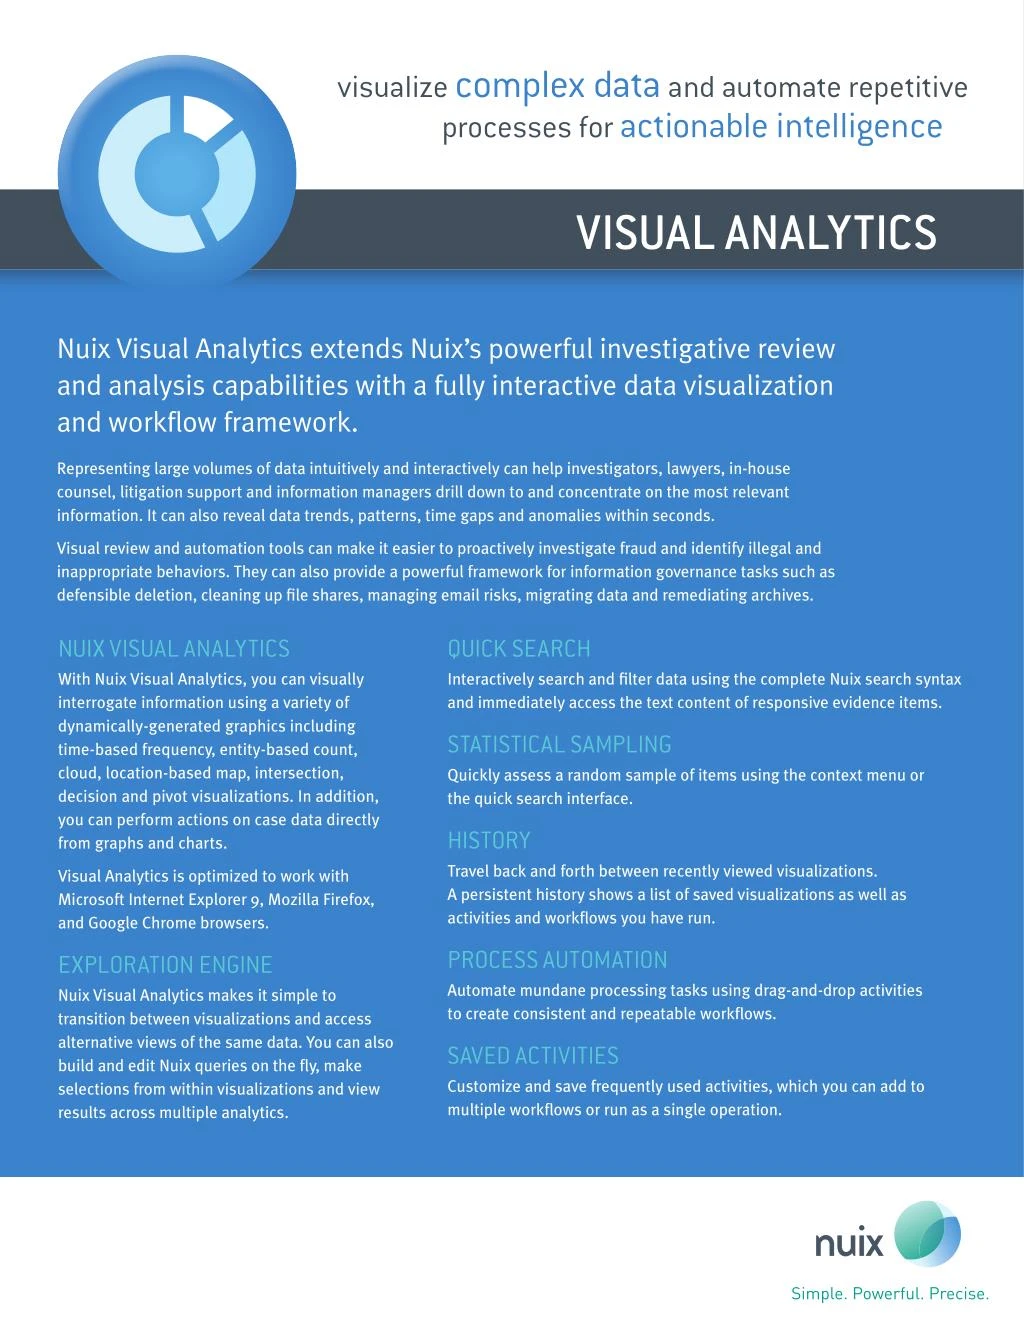
visualize complex data and automate repetitive processes for actionable intelligence VISUAL ANALYTICS Nuix Visual Analytics extends Nuix’s powerful investigative review and analysis capabilities with a fully interactive data visualization and workflow framework. Representing large volumes of data intuitively and interactively can help investigators, lawyers, in-house counsel, litigation support and information managers drill down to and concentrate on the most relevant information. It can also reveal data trends, patterns, time gaps and anomalies within seconds. Visual review and automation tools can make it easier to proactively investigate fraud and identify illegal and inappropriate behaviors. They can also provide a powerful framework for information governance tasks such as defensible deletion, cleaning up file shares, managing email risks, migrating data and remediating archives. NUIX VISUAL ANALYTICS With Nuix Visual Analytics, you can visually interrogate information using a variety of dynamically-generated graphics including time-based frequency, entity-based count, cloud, location-based map, intersection, decision and pivot visualizations. In addition, you can perform actions on case data directly from graphs and charts. QUICK SEARCH Interactively search and filter data using the complete Nuix search syntax and immediately access the text content of responsive evidence items. STATISTICAL SAMPLING Quickly assess a random sample of items using the context menu or the quick search interface. HISTORY Travel back and forth between recently viewed visualizations. A persistent history shows a list of saved visualizations as well as activities and workflows you have run. Visual Analytics is optimized to work with Microsoft Internet Explorer 9, Mozilla Firefox, and Google Chrome browsers. PROCESS AUTOMATION Automate mundane processing tasks using drag-and-drop activities to create consistent and repeatable workflows. EXPLORATION ENGINE Nuix Visual Analytics makes it simple to transition between visualizations and access alternative views of the same data. You can also build and edit Nuix queries on the fly, make selections from within visualizations and view results across multiple analytics. SAVED ACTIVITIES Customize and save frequently used activities, which you can add to multiple workflows or run as a single operation.
visual analytics ANALYTICS CAPABILITIES Nuix Visual Analytics comes with a broad variety of built-in visualizations and report types, including: • Count – View the interaction between specific individuals or groups, compare them and identify similar characteristics. • Cloud – The tag cloud is interactive, providing you with perspectives on the leading or dominant occurrences in your data set. • Date – Identify multiple threads over time, find a specific date in which an event occurred and see when events became major turning points. • Map – Extract the geographical locations of relevant items in the data set and plot the results on a Google map. • Pivot – Compare two variables at once and group results to quickly uncover how variables associate and compare. • Intersection – Compare entities in a Venn diagram and evaluate the overlapping data sets. • Decision – Break down your data by percentage of tagged, excluded or no-action items. • Search Hit Report – Load a previously generated CSV file, and run a Query or Tag operation across your data set. • Case Configuration Report – Outline the global options and case options of the current case open in Nuix Desktop. MAP VISUALIZATION DATE VISUALIZATION ACTIVITY MANAGEMENT CAPABILITIES The activity templates provide access to pre-built workflows including: • Culling – Annotate – Apply a tag or exclusion rule to items based on a query – Date Filter – Tag or exclude items based on a date range – Deduplicate – Deduplicate your data globally or for each custodian using Nuix production set logic – De-NIST – Based on standard NIST or customized digest lists. • OCR – Export – Export PDF files to an ABBYY watched folder for optical recognition – Pause – Add a pause between workflow activities – PDF and Text Importer – Re-import exported case files after OCR. • Search and Tag – Run any number of search terms and tag the results automatically based on a list in a CSV file. SEARCH AND TAG Representing data visually helps to drill down and concentrate on the most relevant information
bringingautomation and intelligent analysisto eDiscovery, information governance and investigations PIVOT VISUALIZATION DECISION VISUALIZATION INTERSECTION VISUALIZATION SEARCH HIT REPORT FEATURES • A comprehensive set of analytics allows you to visually explore data to: – Easily view evidence items over time – Quickly assess frequency of items related to a person or other entity – View clustered information in column, bar, or line graphs – Determine the percentage of tagged, excluded, and no action items – See how sets of data intersect – Find stand-out tags or other entities in a cloud – Drill down into each graphic to see the tabular listing of metadata for selected items (the tabular listing honors all metadata profiles) • Drag and drop activities to create repeatable workflows Create material for external presentation with a full suite of exportable graphs and charts by: – Printing graphics – Exporting graphics to PNG, JPG, PDF, or SVG – Exporting tabular data to PDF or Microsoft Excel. •
visual analytics BENEFITS • Guided data exploration – Quickly drill down into the who, what, when and where of your case with built-in visualizations and reports. • Act on your data in real-time – Move from exploring your data to operating on it. • Increase consistency – Ensure you perform a consistent, repeatable and defensible process by dragging and dropping Nuix activities into a workflow, saving it and running it repeatedly. • Automate processes – Eliminate the need for an operator to watch and wait for one process to complete before starting the next. You can daisy-chain a series of activities together and let them run. Nuix Visual Analytics can send an email update as each workflow activity is completed. • Analyze data visually – Conduct an interactive and intuitive visual analysis of your case data. Seeing data in this way can help you find trends, patterns, time gaps and anomalies in seconds. • Create static reports – Package the results of your analysis to use as a powerful communication tool for managers or other stakeholders. FIND OUT MORE AT: nuix.com/visualanalytics ABOUT NUIX Nuix is a worldwide provider of information management technologies, including eDiscovery, electronic investigation and information governance software. Nuix’s powerful, intuitive technology makes it possible to search, investigate and actively manage unstructured data sets of any size or complexity. This enables organizations to respond quickly and effectively to litigation or regulatory action, mitigate risks, reduce costs and extract value. Nuix customers include the world’s leading advisory firms, litigation support providers, enterprises, government departments, law enforcement agencies, and all of the world’s major corporate regulatory bodies. CONTACT DETAILS: Asia Pacific +61 2 9280 0699 sales@nuix.com // nuix.com // twitter.com/nuix EMEA +44 207 868 1936 North America +1 877 470 6849