Download
1 / 23
230 likes | 335 Views
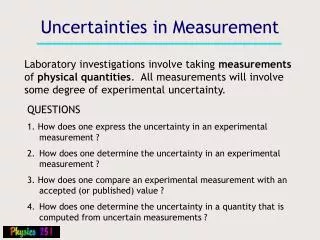
Uncertainties in atmospheric observations. Wenche Aas EMEP/CCC. Sources of uncertainties. Sampling and analytical method Detection limit Interference Instrument drift, calibration Positive or negative artefact Sampling procedure Contamination Temperature and period for storage

E N D
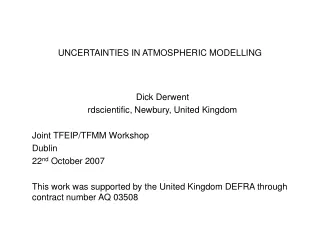
Uncertainties in atmospheric observations Wenche Aas EMEP/CCC
Sources of uncertainties • Sampling and analytical method • Detection limit • Interference • Instrument drift, calibration • Positive or negative artefact • Sampling procedure • Contamination • Temperature and period for storage • Transport • Representativity. • Local farming (NH3) • Nearby roads (NOx; O3) • Dust (PM, Ca..) Lab- and field intercomparison Field inter-comparison; model comparison Repr. studies, i.e passive sampling. Model comparison
Monitoring programme: • Level 1 • Main ions in precipitation and in air • heavy metals in precipitations • ozone • PM10 and PM2.5 mass • meteorology • at ca 125 sites • Level 2, supersite (joint EMEP/GAW) • POPs • Heavy metals in air and aerosols • VOC • EC/OC, OC speciation • Mineral Dust • PM speciation incl. gas particle ratio • + all level 1 activities • 15-20 sites Both levels are mandatory by all Parties
Data quality objectives • Acidifying and eutrophying compounds • 15-25% uncertainty in annual average (10-15% for indiv meas.) • Heavy metals • 30% uncertainty in annual average (15-25% for indiv meas.) • 40 % uncertainty for As, Cd, Ni in the EU 4th DD (70% in dep) • 50% uncertainty for Hg (total gas) in the EU 4th DD • POPs (not defined in EMEP) • 50% uncertainty for PAH in the EU 4th DD (70% in dep) • PM (not defined in EMEP) • 25% accuracy in continuous measurements EU 1st DD • Photooxidants (not defined in EMEP) • : 15% accuracy in continuous O3, NOx measurements, EU 3rd DD
Lab intercomparisons annually, 2005 Bias: RB % Spread: 2RSD %
WMO ICP
SO2 field intercomparison Preila (LT) using filterpack Zarra (ES) , abs (H202) and monitor TCM ain Germany (historic data) at DE09 (left and DE03 (right)
NO2. Chemiluminisence (Mo converter) Not selective for NO2
QA flag Lab flag Green: Bias < 10% Spread <20% (S,N) Blue: Bias < 40% Spread <40% (S,N) Field flag Green: Bias < 10% Spread <25% Blue: Bias < 50% Spread <50%
QA Flag for main ions in 2005 In precip In air • Analysis in lab are in general better than 20% (both in air and precip) • Total uncertainty (field intercomp): • about half the measurements is better than 25% • rest better than 50%
Lab intercomparison of HM annually Average per cent error, 2005
Hg intercomparison at DE02 in 2006 Tot Hg(g) in air Tot Hg in precip
Heavy metal deposition, CEN WG20 Birkenes, comparing wet only (analysed at UBA) and bulk (NILU)
Parallell wet only, CEN WG 20 Relative SD in deposition measurements:
Artefact in gas/particle for N IT01, Jan 2007 Underestimation of N Artefact free measurements using denuders only done at Montelibretti IT01, June 2007
Estimates of the positive artefact of OC in PM10 and PM2.5/PM1 -June 2006 QBQ-approach
Uncertainties in trends SO2 SO4 in air
Representativity, NO2 ES07 Comparing EMEP model and obs. in light of population density IT01 NL91 BE32 AT02
Conclusions • Many factors influence uncertainty in measurements • Methodology, sampling procedure, Representativity • Need to distinguish between uncertainty in one data point, in averages and trends; and distinguish between bias and spread • In general, the measurements are within DQO if reference methods are used and the site is representative, but there are exceptions • Need to have better control of artefacts, especially nitrogen gas/particle and EC/OC • More intercomparison of other species than main comp and HM are needed
Data quality objectives • Acidifying and eutrophying compounds • 15-25% uncertainty in annual average (10-15% for indiv meas.) • Heavy metals • 30% uncertainty in annual average (15-25% for indiv meas.) • 40 % uncertainty for As, Cd, Ni in the EU 4th DD (70% in dep) • 50% uncertainty for Hg (total gas) in the EU 4th DD • POPs (not defined in EMEP) • 50% uncertainty for PAH in the EU 4th DD (70% in dep) • PM (not defined in EMEP) • 25% accuracy in continuous measurements EU 1st DD • Photooxidants (not defined in EMEP) • : 15% accuracy in continuous O3, NOx measurements, EU 3rd DD