Download
1 / 11
110 likes | 241 Views
TAFTS: Comparing Uncertainties in Atmospheric Profiles with the Water Vapour Continuum. Ralph Beeby, Paul Green, Juliet Pickering, John Harries. Context Case study: B400 Atmospheric profiles / Jacobians Comparing continuum with measurement errors. Context.

E N D
TAFTS: Comparing Uncertainties in Atmospheric Profiles with the Water Vapour Continuum Ralph Beeby, Paul Green, Juliet Pickering, John Harries
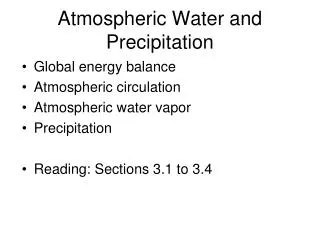
Context • Case study: B400 • Atmospheric profiles / Jacobians • Comparing continuum with measurement errors
Context • TAFTS (Tropospheric Airborne Fourier Transform Spectrometer) used to measure in-situ far-infrared atmospheric radiances • Aim: to use TAFTS measurements to measure the water vapour continuum as part of CAVIAR • Need to compare TAFTS spectra with simulations based on existing line databases • LBLRTM (Line by Line Radiative Transfer Model) used: can easily adjust strength of continuum absorption within this model • Can also incorporate measurements of atmospheric conditions from, e.g., radiosondes as model input
Context Radiometers to measure spectra – TAFTS1, ARIES2 Onboard instruments and sondes: auxiliary measurements Calibrate radiometers at NPL3 Field campaigns: Camborne, Jungfraujoch Generate best estimate of atmospheric profile Use profile as input to LBLRTM4 Calibrate data to obtain water vapour spectrum LBLRTM calculates expected water vapour spectrum according to current HITRAN5/CKD6 parameters Compare LBLRTM with TAFTS so that monomer lines agree within errors Compare differences in “micro-window” regions to estimate error in water vapour continuum 1 Tropospheric Airborne Fourier Transform Spectrometer 2 Airborne Research Interferometer Evaluation System 3 National Physical Laboratory 4 Line By Line Radiative Transfer Model 5 High-resolution Transmission molecular absorption database 6 Clough, Kneizys, Davies
Atmospheric Profiling • Combines radiosondes from Camborne, dropsondes from aircraft and model fields from ECMWF • Divide SLR into sections over land and over the sea • Over the sea: use nearest dropsonde as most reliable source • Use nearest radiosonde from top of dropsonde profile up to 100mb • ECMWF up to top of model atmosphere • Look at variation in ECMWF with time and space, apply similar variation to sonde profiles where necessary Pressure / mb Water vapour / %RH Temperature / K
dR/d log[vmr(H2O)] / mWm2sr.cm-1/log[vmr] Wavenumber / cm-1 Uncertainty in Profiles • Jacobians in LBLRTM used to assess sensitivity of spectra to uncertainties in temperature and relative humidity • Analytic Jacobians: calculate dR/dx across spectral range where R = radiance and x = atmospheric parameter • Indicates the change in radiance that would be caused by a change in a given atmospheric parameter (e.g., temperature, relative humidity) • Integrate over column to obtain estimate uncertainty
Comparing Continuum with Measurement Errors • Looking for areas of spectra where sensitivity to the continuum is high (DRcont) relative to realistic uncertainties in the atmospheric (temperature and water vapour) profile used in the simulated data (DRsim) – so where • DRcont<DRsim – will not be able to define continuum • DRcont≈DRsim – possible to define continuum depending on ability to separate contributions • DRcont>DRsim – will be able to measure continuum • Adjust strength of foreign-broadened continuum in simulation • Use Jacobians to calculate changes in radiance due to errors in RH, T and “representation error” • Compare DR for both cases – at which wavelengths can we define continuum?
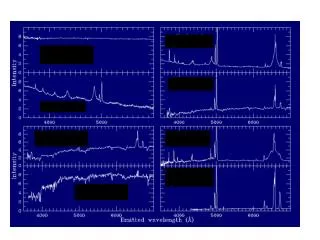
Comparing Continuum with Measurement Errors • Example: simulation of 20,000ft run, DW view • Two window regions • LBLRTM simulation with normal continuum (black) compared with continuum strength adjusted by ±25% (red) • Measurement uncertainties calculated from Jacobians (blue) assume an error equivalent to ±10%RH from a combination of instrument and representation error
Comparing Continuum with Measurement Errors • Change in radiance due to profile uncertainty (black) • Change in radiance due to change in continuum strength (blue)
Conclusions • Model simulation used to compare effects on radiance of - Uncertainty in atmospheric profile (RH, T) - Changes to foreign-broadened continuum • Example: 20,000ft flight level • In some windows, change in continuum shows greater change in radiance can measure continuum in these Coming Soon • Similar simulations for other flight levels – determine which other windows can be used to measure continuum at different altitudes • Calibrating TAFTS spectra • Compare TAFTS spectra with simulations to measure continuum