Download
1 / 11
110 likes | 189 Views
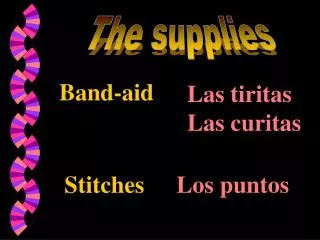
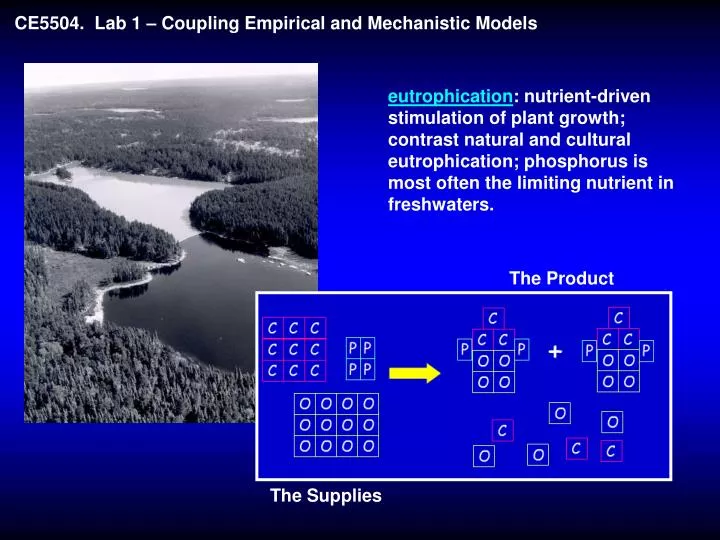
The Product. The Supplies. CE5504. Lab 1 – Coupling Empirical and Mechanistic Models. eutrophication : nutrient-driven stimulation of plant growth; contrast natural and cultural eutrophication; phosphorus is most often the limiting nutrient in freshwaters.

E N D
The Product The Supplies CE5504. Lab 1 – Coupling Empirical and Mechanistic Models eutrophication: nutrient-driven stimulation of plant growth; contrast natural and cultural eutrophication; phosphorus is most often the limiting nutrient in freshwaters.
Manifestations of eutrophication - transparency Dodson 2005
Summer Spring Depth (m) Temperature (°C) Manifestations of eutrophication – oxygen depletion
mgO2L-1 A M J J A S Manifestations of eutrophication – oxygen depletion
Q∙P W As V v∙As BUDGET MODEL for phosphorus
3 log Chl = 0.813log TP-0.240 R2 = 0.59 2 log chlorophyll (mgm-3) 1 0 (b) -1 -1 1 0 2 3 log total phosphorus (mgPm-3) TROPHIC STATE CORRELATIONS – phosphorus and chlorophyll
(a) 3.0 2.0 Secchi Disk Transparency (m) 1.0 0.5 log SD = -0.54log Chl + 0.78 R2 = 0.76 10 50 2.5 5 25 50 Chlorophyll (mgm-3) TROPHIC STATE CORRELATIONS – chlorophyll and Secchi disk
(c) Areal Hypolimnetic Oxygen Demand (gO2m-2d-1) AHOD = 0.0145TP + 0.47 R2 = 0.79 Total Phosphorus (mgPm-3) TROPHIC STATE CORRELATIONS – phosphorus and AHOD
ASSIGNMENT: Lab 1. Coupling Empirical and Mechanistic Models