Download
1 / 22
220 likes | 326 Views
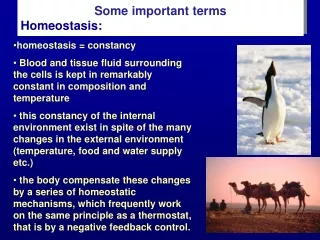
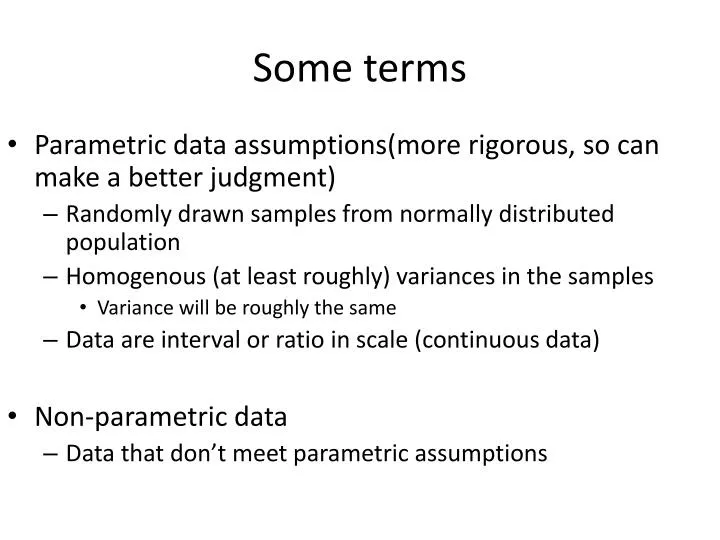
Some terms. Parametric data assumptions(more rigorous, so can make a better judgment) Randomly drawn samples from normally distributed population Homogenous (at least roughly) variances in the samples Variance will be roughly the same Data are interval or ratio in scale (continuous data)

E N D
Some terms • Parametric data assumptions(more rigorous, so can make a better judgment) • Randomly drawn samples from normally distributed population • Homogenous (at least roughly) variances in the samples • Variance will be roughly the same • Data are interval or ratio in scale (continuous data) • Non-parametric data • Data that don’t meet parametric assumptions
Some terms • Power • The ability to find a difference, if one exists • There is always a difference, just is it statistically sig. • Used a priori (how big of a sample size is needed) and post hoc (if the lack of difference due to a too small sample size) • Function of four factors (all go up as power goes up, direct relationship, except variance) • Significance criterion • Variance (within group variance changes opposite of power) • Sample size • Effect size • Significance • The probability of committing a Type I error-acceptable risk of making a mistake Saying there is a difference when none exists • Also known as the alpha level
Some terms • p value • Finding after your statistical analysis • Probability of finding that big a difference by chance • % that event occurred by chance • Randomization • Selection • Every member of group has equal chance of selection • Assignment • Each member has an equal chance of being assigned to any of the groups
Experimental Design • Sometimes called a Clinical Trial • Therapeutic – effect of treatment on disease • Preventive – effective at reducing development of disease • Provides structure to evaluate causality • Independent Variables • May be multiple • May each have multiple levels • Dependent Variables • May be multiple • Element of control • Improves argument for causality
Clinical Trial • New therapies, drugs, procedures, devices Box 10.1 • Distinct sequence • Preclinical • Often animal model • Phase I • Establish safety • Small sample size • Phase II • Still small sample • Effectiveness
Clinical Trial • Phase III • Usually randomized controlled, double blind • Large sample • Comparison to standard or placebo • Phase IV • Other populations • Risk factors/benefits • Optimal use
Design Classifications • True Experimental • RCT the “Gold Standard” of this design • This design is differentiated by assignment • Between subjects (“completely randomized”) • Selected randomly, and divided randomly • Randomized block (age, gender exclusion) • Within subjects (subjects serve as their own control) • Sometimes described by the number of “Factors” • Factors = Independent Variables (IV) in this context • Single factor means one IV • Multi-factor means more than one IV • Quasi- Experimental • Lack random assignment &/or • Lack comparison group
Selecting a Design • What is your PICO? • Can the IV be manipulated? • Can you control extraneous factors? • If experimental design is right then ask • How many IVs? • How many levels in each IV? • How many groups will be tested? • How will assignment be made? • How often will measurements be taken? • What is the time sequence?
Selecting a Design • Pretest-posttest Control Group • Figures 10.1 -10.3 • Analysis • Interval-scale data • Two groups – t-test (unpaired, also called independent) • Three or more groups – ANOVA (usually one-way) • Could be ANCOVA (pre-test score is the covariate) • Could be two way • Treatment as one factor • Other factor is the repeated factor of time (pre-test/post-test) • Ordinal Data • Two groups – Mann-Whitney U-test • Three or more groups – Kruskal-Wallis analysis of variance by ranks
Selecting a Design • Posttest-Only Control Group • Figures 10.1 -10.3 • Analyzed with • Interval-scale data • Two groups – t-test (independent) • Three or more groups - One way ANOVA • Ordinal Data • Two groups – Mann-Whitney U-test • Three or more groups – Kruskal-Wallis analysis of variance by ranks May also analyze with ANCOVA if extraneous relevant data are available Regression or discriminate analysis can be applied
Selecting a Design • Multi-factorial • What are factors? • Nomenclature • IV with number indicating the number of levels of that IV • 3 X 4 multifactorial test • Two IVs • One with 3 levels, one with 4 levels • 3x3x3 • Three Ivs • One with 3 levels, second with 3 levels, third with 3 levels • Analyzed with (most commonly) • Two way ANOVA • Three way ANOVA
Selecting a Design • Multi-factorial • In Two way factorial design, three questions can be addressed (In this example , consider 2 x 2 design) • Main effects (2) • Of each IV • The other IV “collapsed” across levels • Interaction effect (1) • Between the two Ivs - • Every independent variable has a MAIN EFFECT: so 5 IV means 5 main effects
Selecting a Design • Multi-factorial • In Three way factorial design, multiple questions can be addressed (In this example , consider 2 x 2 x 2 design) • Main effects (3) • Of each IV • The other IV “collapsed” across levels • Double interaction effects (3) • Between the three possibilities of IV pairings • Triple interaction (8) • The possible interactions of all 6 levels • Figure 10.6 good to visualize this
Selecting a Design • Randomized block • Homogeneous blocks • Then randomly assigned to one level of the IV (Fig 10.7) Can be thought of as two single factor randomized experiments • Analyzed with • Two way ANOVA Multiple Regression or discriminate analysis can be applied
Selecting a Design • Repeated Measures=type of analysis • What are factors=are IV’s • Can the control be any more equivalent? (Rhetorical ?) • Serve as own control, so not really can’t get any more equivalent. • Disadvantages • Carryover=irritation • Practice effects=improved skill, comfort level with activity • Outcome measure must return to baseline between interventions • Single Factor Repeated • Analyzed with • One way ANOVA
Selecting a Design • Crossover Design • Counterbalance the treatment conditions • “Washout” period to return to baseline (like letting a drug leave the body) • May only have two levels of an independent variable • Analyzed with • Interval-scale data • t-test for change scores by treatment condition • Two way ANOVA with two repeated measures • Pre-test post test • Across both conditions • Ordinal Data • Wilcoxen signed ranks *IF it is named after someone than not continuous (exception Person’s Product.
Selecting a Design • Two Way with Two Repeated Measures • 2 X 2 • Analyzed with • Two way ANOVA with two repeated measures • Mixed Design • One factor is repeated (often time is the factor) • One Factor is randomly assigned • Analyzed with • Two way ANOVA with one repeated measures
Selecting a Design • Sequential Clinical Trial • Special approach to the RCT • Data continually analyzed • Compares two treatments to find the preferred one • A series of “little experiments” • Preference subjective but clearly defined • Those without a preference are excluded from analysis • Analyzed by charting • Three choices • Stop and recommend one treatment • Stop and state you found no difference • Continue collecting data
Efficacy vs Effectiveness • Efficacy is clinical • Under a controlled situation • The Lab result • Effectiveness is “Real World” • When control cannot be maintained • The application in practice
Quasi Experimental • One Group Pretest-posttest • Time is the IV • Treatment is not the IV (WHY? –Because they all get it) • Analyzed with • Interval-scale data • Paired t-test • Why not ANOVA? • Ordinal Data • Sign test • Wilcoxen signed-ranks test • One-Way repeated Measures over Time • Analyzed with the ANOVA. WHY?
Quasi Experimental • Time Series • Considered extension of the one-group pretest-posttest • Multiple measurements • Before and after treatment • Serve as pseudo-control • Analyzed with • Visual chart analysis • Multivariate methodologies
Quasi Experimental • Multi-group Design • Non-equivalent pretest – posttest Control Group • Analyzed with • Multiple options here • Consider non-parametric tests!!! • Not ordinal/continuous data, not normally distributed, • Non-equivalent posttest only Control Group • Analyzed with • Regression approach • Looking for relationships, but not causality