Download
1 / 46
460 likes | 465 Views
This lecture covers the definition of probability, Bayes' theorem, probability densities, statistical tests, parameter estimation, interval estimation, systematic errors, and Monte Carlo methods.

E N D
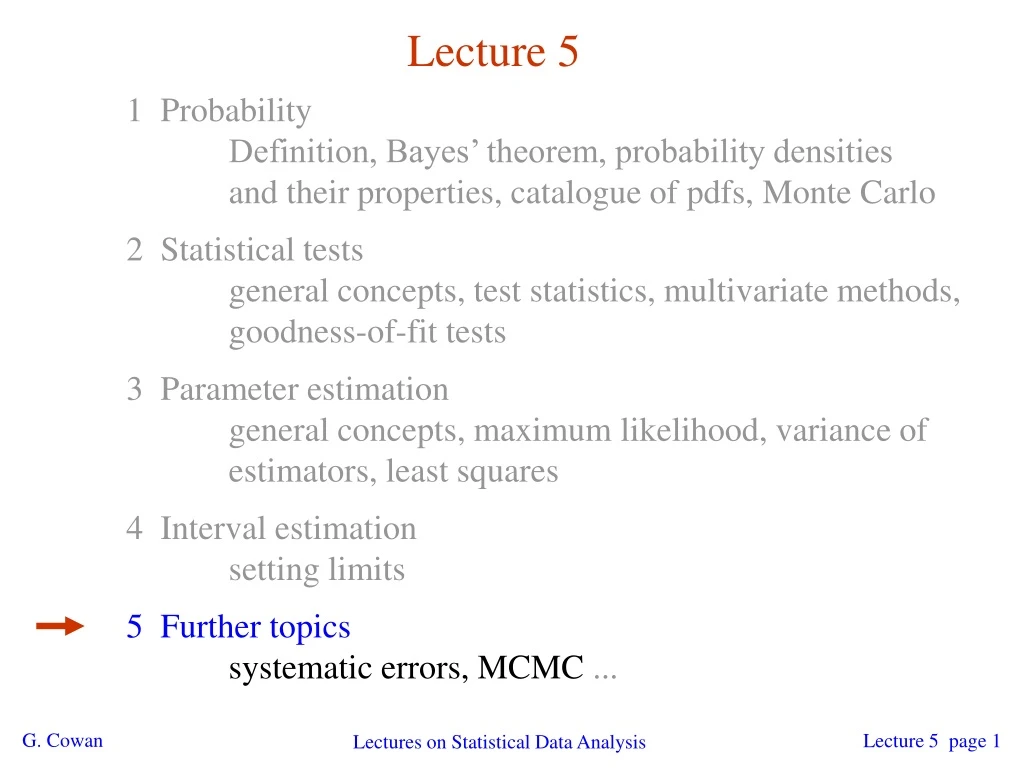
Lecture 5 1 Probability Definition, Bayes’ theorem, probability densities and their properties, catalogue of pdfs, Monte Carlo 2 Statistical tests general concepts, test statistics, multivariate methods, goodness-of-fit tests 3 Parameter estimation general concepts, maximum likelihood, variance of estimators, least squares 4 Interval estimation setting limits 5 Further topics systematic errors, MCMC ... Lectures on Statistical Data Analysis
Statistical vs. systematic errors Statistical errors: How much would the result fluctuate upon repetition of the measurement? Implies some set of assumptions to define probability of outcome of the measurement. Systematic errors: What is the uncertainty in my result due to uncertainty in my assumptions, e.g., model (theoretical) uncertainty; modelling of measurement apparatus. The sources of error do not vary upon repetition of the measurement. Often result from uncertain value of, e.g., calibration constants, efficiencies, etc. Lectures on Statistical Data Analysis
Systematic errors and nuisance parameters Response of measurement apparatus is never modelled perfectly: y (measured value) model: truth: x (true value) Model can be made to approximate better the truth by including more free parameters. systematic uncertainty ↔ nuisance parameters Lectures on Statistical Data Analysis
Nuisance parameters Suppose the outcome of the experiment is some set of data values x (here shorthand for e.g. x1, ..., xn). We want to determine a parameter q, (could be a vector of parameters q1, ..., qn). The probability law for the data x depends on q : L(x| q) (the likelihood function) E.g. maximize L to find estimator Now suppose, however, that the vector of parameters: contains some that are of interest, and others that are not of interest: Symbolically: The are called nuisance parameters. Lectures on Statistical Data Analysis
Example #1: fitting a straight line Data: Model: measured yi independent, Gaussian: assume xi and si known. Goal: estimate q0 (don’t care about q1). Lectures on Statistical Data Analysis
Case #1: q1 known a priori For Gaussian yi, ML same as LS Minimize c2→estimator Come up one unit from to find Lectures on Statistical Data Analysis
Case #2: both q0 and q1 unknown Standard deviations from tangent lines to contour Correlation between causes errors to increase. Lectures on Statistical Data Analysis
Case #3: we have a measurement t1 of q1 The information on q1 improves accuracy of Lectures on Statistical Data Analysis
The profile likelihood The ‘tangent plane’ method is a special case of using the profile likelihood: is found by maximizing L (q0, q1) for each q0. Equivalently use The interval obtained from is the same as what is obtained from the tangents to Well known in HEP as the ‘MINOS’ method in MINUIT. Profile likelihood is one of several ‘pseudo-likelihoods’ used in problems with nuisance parameters. See e.g. talk by Rolke at PHYSTAT05. Lectures on Statistical Data Analysis
The Bayesian approach In Bayesian statistics we can associate a probability with a hypothesis, e.g., a parameter value q. Interpret probability of q as ‘degree of belief’ (subjective). Need to start with ‘prior pdf’ p(q), this reflects degree of belief about q before doing the experiment. Our experiment has data x, → likelihood functionL(x|q). Bayes’ theorem tells how our beliefs should be updated in light of the data x: Posterior pdf p(q | x) contains all our knowledge about q. Lectures on Statistical Data Analysis
Case #4: Bayesian method We need to associate prior probabilities with q0 and q1, e.g., reflects ‘prior ignorance’, in any case much broader than ←based on previous measurement Putting this into Bayes’ theorem gives: posterior Q likelihood prior Lectures on Statistical Data Analysis
Bayesian method (continued) We then integrate (marginalize) p(q0, q1 | x) to find p(q0 | x): In this example we can do the integral (rare). We find Ability to marginalize over nuisance parameters is an important feature of Bayesian statistics. Lectures on Statistical Data Analysis
Digression: marginalization with MCMC Bayesian computations involve integrals like often high dimensionality and impossible in closed form, also impossible with ‘normal’ acceptance-rejection Monte Carlo. Markov Chain Monte Carlo (MCMC) has revolutionized Bayesian computation. Google for ‘MCMC’, ‘Metropolis’, ‘Bayesian computation’, ... MCMC generates correlated sequence of random numbers: cannot use for many applications, e.g., detector MC; effective stat. error greater than √n . Basic idea: sample multidimensional look, e.g., only at distribution of parameters of interest. Lectures on Statistical Data Analysis
MCMC basics: Metropolis-Hastings algorithm Goal: given an n-dimensional pdf generate a sequence of points Proposal density e.g. Gaussian centred about 1) Start at some point 2) Generate 3) Form Hastings test ratio 4) Generate move to proposed point 5) If else old point repeated 6) Iterate Lectures on Statistical Data Analysis
Metropolis-Hastings (continued) This rule produces a correlated sequence of points (note how each new point depends on the previous one). For our purposes this correlation is not fatal, but statistical errors larger than naive The proposal density can be (almost) anything, but choose so as to minimize autocorrelation. Often take proposal density symmetric: Test ratio is (Metropolis-Hastings): I.e. if the proposed step is to a point of higher , take it; if not, only take the step with probability If proposed step rejected, hop in place. Lectures on Statistical Data Analysis
Metropolis-Hastings caveats Actually one can only prove that the sequence of points follows the desired pdf in the limit where it runs forever. There may be a “burn-in” period where the sequence does not initially follow Unfortunately there are few useful theorems to tell us when the sequence has converged. Look at trace plots, autocorrelation. Check result with different proposal density. If you think it’s converged, try it again starting from 10 different initial points and see if you find same result. Lectures on Statistical Data Analysis
Example: posterior pdf from MCMC Sample the posterior pdf from previous example with MCMC: Summarize pdf of parameter of interest with, e.g., mean, median, standard deviation, etc. Although numerical values of answer here same as in frequentist case, interpretation is different (sometimes unimportant?) Lectures on Statistical Data Analysis
Case #5: Bayesian method with vague prior Suppose we don’t have a previous measurement of q1 but rather some vague information, e.g., a theorist tells us: q1≥ 0 (essentially certain); q1 should have order of magnitude less than 0.1 ‘or so’. Under pressure, the theorist sketches the following prior: From this we will obtain posterior probabilities for q0 (next slide). We do not need to get the theorist to ‘commit’ to this prior; final result has ‘if-then’ character. Lectures on Statistical Data Analysis
Sensitivity to prior Vary () to explore how extreme your prior beliefs would have to be to justify various conclusions (sensitivity analysis). Try exponential with different mean values... Try different functional forms... Lectures on Statistical Data Analysis
Example #2: Poisson data with background Count n events, e.g., in fixed time or integrated luminosity. s = expected number of signal events b = expected number of background events n ~ Poisson(s+b): Sometimes b known, other times it is in some way uncertain. Goal: measure or place limits on s, taking into consideration the uncertainty in b. Lectures on Statistical Data Analysis
Classical procedure with measured background Suppose we have a measurement of b, e.g., bmeas ~ N (b, b) So the data are really: n events and the value bmeas. In principle the confidence interval recipe can be generalized to two measurements and two parameters. Difficult and not usually attempted, but see e.g. talks by K. Cranmer at PHYSTAT03, G. Punzi at PHYSTAT05. G. Punzi, PHYSTAT05 Lectures on Statistical Data Analysis
Bayesian limits with uncertainty on b Uncertainty on b goes into the prior, e.g., Put this into Bayes’ theorem, Marginalize over b, then use p(s|n) to find intervals for s with any desired probability content. Controversial part here is prior for signal s(s) (treatment of nuisance parameters is easy). Lectures on Statistical Data Analysis
Cousins-Highland method Regard b as ‘random’, characterized by pdf (b). Makes sense in Bayesian approach, but in frequentist model b is constant (although unknown). A measurement bmeas is random but this is not the mean number of background events, rather, b is. Compute anyway This would be the probability for n if Nature were to generate a new value of b upon repetition of the experiment with b(b). Now e.g. use this P(n;s) in the classical recipe for upper limit at CL = 1 - b: Result has hybrid Bayesian/frequentist character. Lectures on Statistical Data Analysis
‘Integrated likelihoods’ Consider again signal s and background b, suppose we have uncertainty in b characterized by a prior pdf b(b). Define integrated likelihood as also called modified profile likelihood, in any case not a real likelihood. Now use this to construct likelihood ratio test and invert to obtain confidence intervals. Feldman-Cousins & Cousins-Highland (FHC2), see e.g. J. Conrad et al., Phys. Rev. D67 (2003) 012002 and Conrad/Tegenfeldt PHYSTAT05 talk. Calculators available (Conrad, Tegenfeldt, Barlow). Lectures on Statistical Data Analysis
Interval from inverting profile LR test Suppose we have a measurement bmeas of b. Build the likelihood ratio test with profile likelihood: and use this to construct confidence intervals. See PHYSTAT05 talks by Cranmer, Feldman, Cousins, Reid. Lectures on Statistical Data Analysis
Wrapping up lecture 5 We’ve seen some main ideas about systematic errors, uncertainties in result arising from model assumptions; can be quantified by assigning corresponding uncertainties to additional (nuisance) parameters. Different ways to quantify systematics Bayesian approach in many ways most natural; marginalize over nuisance parameters; important tool: MCMC Frequentist methods rely on a hypothetical sample space for often non-repeatable phenomena Lectures on Statistical Data Analysis
Lecture 5 — extra slides Lectures on Statistical Data Analysis
A typical fitting problem Given measurements: and (usually) covariances: Predicted value: expectation value control variable parameters bias Often take: Minimize Equivalent to maximizing L() ~ e-2/2, i.e., least squares same as maximum likelihood using a Gaussian likelihood function. Lectures on Statistical Data Analysis
Its Bayesian equivalent Take Joint probability for all parameters and use Bayes’ theorem: To get desired probability for , integrate (marginalize) over b: →Posterior is Gaussian with mode same as least squares estimator, same as from 2 = 2min + 1. (Back where we started!) Lectures on Statistical Data Analysis
The error on the error Some systematic errors are well determined Error from finite Monte Carlo sample Some are less obvious Do analysis in n ‘equally valid’ ways and extract systematic error from ‘spread’ in results. Some are educated guesses Guess possible size of missing terms in perturbation series; vary renormalization scale Can we incorporate the ‘error on the error’? (cf. G. D’Agostini 1999; Dose & von der Linden 1999) Lectures on Statistical Data Analysis
Motivating a non-Gaussian prior b(b) Suppose now the experiment is characterized by where si is an (unreported) factor by which the systematic error is over/under-estimated. Assume correct error for a Gaussian b(b) would be siisys, so Width of s(si) reflects ‘error on the error’. Lectures on Statistical Data Analysis
Error-on-error function s(s) A simple unimodal probability density for 0 < s < 1 with adjustable mean and variance is the Gamma distribution: mean = b/a variance = b/a2 Want e.g. expectation value of 1 and adjustable standard deviation s , i.e., s In fact if we took s(s) ~ inverseGamma, we could integrate b(b) in closed form (cf. D’Agostini, Dose, von Linden). But Gamma seems more natural & numerical treatment not too painful. Lectures on Statistical Data Analysis
Prior for bias b(b) now has longer tails b Gaussian (s = 0) P(|b| > 4sys) = 6.3 £ 10-5 s = 0.5 P(|b| > 4sys) = 0.65% Lectures on Statistical Data Analysis
A simple test Suppose fit effectively averages four measurements. Take sys = stat = 0.1, uncorrelated. Case #1: data appear compatible Posterior p(|y): measurement experiment Usually summarize posterior p(|y) with mode and standard deviation: Lectures on Statistical Data Analysis
Simple test with inconsistent data Case #2: there is an outlier Posterior p(|y): measurement experiment →Bayesian fit less sensitive to outlier. → Error now connected to goodness-of-fit. Lectures on Statistical Data Analysis
Goodness-of-fit vs. size of error In LS fit, value of minimized 2 does not affect size of error on fitted parameter. In Bayesian analysis with non-Gaussian prior for systematics, a high 2 corresponds to a larger error (and vice versa). post- erior 2000 repetitions of experiment, s = 0.5, here no actual bias. from least squares 2 Lectures on Statistical Data Analysis
Is this workable in practice? Straightforward to generalize to include correlations Prior on correlation coefficients ~ () (Myth: = 1 is “conservative”) Can separate out different systematic for same measurement Some will have small s, others larger. Remember the “if-then” nature of a Bayesian result: We can (should) vary priors and see what effect this has on the conclusions. Lectures on Statistical Data Analysis
Bayesian model selection (‘discovery’) The probability of hypothesis H0 relative to its complementary alternative H1 is often given by the posterior odds: no Higgs Higgs prior odds Bayes factor B01 The Bayes factor is regarded as measuring the weight of evidence of the data in support of H0 over H1. Interchangeably use B10 = 1/B01 Lectures on Statistical Data Analysis
Assessing Bayes factors One can use the Bayes factor much like a p-value (or Z value). There is an “established” scale, analogous to HEP's 5s rule: B10 Evidence against H0 -------------------------------------------- 1 to 3 Not worth more than a bare mention 3 to 20 Positive 20 to 150 Strong > 150 Very strong Kass and Raftery, Bayes Factors, J. Am Stat. Assoc 90 (1995) 773. Lectures on Statistical Data Analysis
Rewriting the Bayes factor Suppose we have models Hi, i = 0, 1, ..., each with a likelihood and a prior pdf for its internal parameters so that the full prior is where is the overall prior probability for Hi. The Bayes factor comparing Hi and Hj can be written Lectures on Statistical Data Analysis
Bayes factors independent of P(Hi) For Bij we need the posterior probabilities marginalized over all of the internal parameters of the models: Use Bayes theorem Ratio of marginal likelihoods So therefore the Bayes factor is The prior probabilities pi = P(Hi) cancel. Lectures on Statistical Data Analysis
Numerical determination of Bayes factors Both numerator and denominator of Bij are of the form ‘marginal likelihood’ Various ways to compute these, e.g., using sampling of the posterior pdf (which we can do with MCMC). Harmonic Mean (and improvements) Importance sampling Parallel tempering (~thermodynamic integration) ... See e.g. Lectures on Statistical Data Analysis
Harmonic mean estimator E.g., consider only one model and write Bayes theorem as: p(q) is normalized to unity so integrate both sides, posterior expectation Therefore sample q from the posterior via MCMC and estimate m with one over the average of 1/L (the harmonic mean of L). Lectures on Statistical Data Analysis
Improvements to harmonic mean estimator The harmonic mean estimator is numerically very unstable; formally infinite variance (!). Gelfand & Dey propose variant: Rearrange Bayes thm; multiply both sides by arbitrary pdf f(q): Integrate over q : Improved convergence if tails of f(q) fall off faster than L(x|q)p(q) Note harmonic mean estimator is special case f(q) = p(q). . Lectures on Statistical Data Analysis
Importance sampling Need pdf f(q) which we can evaluate at arbitrary q and also sample with MC. The marginal likelihood can be written Best convergence when f(q) approximates shape of L(x|q)p(q). Use for f(q) e.g. multivariate Gaussian with mean and covariance estimated from posterior (e.g. with MINUIT). Lectures on Statistical Data Analysis
Bayes factor computation discussion Also tried method of parallel tempering; see note on course web page and also Harmonic mean OK for very rough estimate. I had trouble with all of the methods based on posterior sampling. Importance sampling worked best, but may not scale well to higher dimensions. Lots of discussion of this problem in the literature, e.g., Lectures on Statistical Data Analysis


![[lecture#5]](https://cdn0.slideserve.com/109460/slide1-dt.jpg)