Download
1 / 23
290 likes | 562 Views
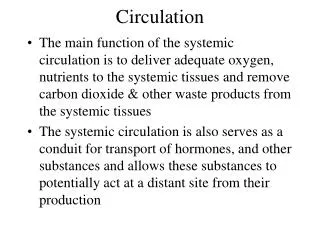
Atlantic Meridional Overturning Circulation (AMOC): Status, Requirements, and Issues. Molly Baringer NOAA/AOML w ith contributions from B. Johns, C. Meinen, S. Garzoli, S. Dong, R. Perez, S. Lozier,J . Willis, U. Send and many others. The Meridional Overturning Circulation.

E N D
Atlantic Meridional Overturning Circulation (AMOC): Status, Requirements, and Issues Molly Baringer NOAA/AOML with contributions from B. Johns, C. Meinen, S. Garzoli, S. Dong, R. Perez, S. Lozier,J. Willis, U. Send and many others
The Meridional Overturning Circulation The warm and salty water that spreads in the North Atlantic is cooled primarily by evaporation, sinks to the deep ocean and forms the North Atlantic Deep Water. The NADW flows southward along the Americas, and around the world, global upwelling occur, enters the SA at the intermediate water level South of Africa and return to the deep water formation regions through the SA.
Climate impacts of Atlantic multi-decadal SST variability PI: Tom Delworth1 , Yochanon Kushnir2 NOAA/GFDL, Princeton, NJ 2 LDEO, Columbia University, NY Models and data provide increasing evidence that Atlantic multidecadal variability (AMV) affects climate in and around the Atlantic basin. These impacts are caused mainly by tropical Atlantic SST changes associated with the AMV. Impacts include Sahel and west/ central Indian rainfall, the number of Atlantic hurricanes, and possibly ENSO activity.
Atlantic MOC ECCO-50y ECCO-SIO ECCO-GODAE ECCO-JPL GFDL INGV SODA
Central questions surrounding the AMOC include: The design and implementation of an AMOC monitoring system An assessment of AMOC’s role in the global climate An assessment of AMOC predictability
Status: AMOC Program Lead P.I.’s Molly Baringer (NOAA.AOML) Amy Bower (WHOI) James Carton (U. Maryland) Ping Chang (Texas A&M) Ruth Curry (WHOI) Tom Delworth (GFDL) Kathleen Donohue (URI) George Halliwell (NOAA/AOML) Gordon Hamilton (U. Miami) Bill Johns (U. Miami) Terry Joyce (WHOI) Igor Kamenkovich (U. Miami) Kathy Kelly (U. Washington) Craig Lee (U. Washington) Tong Lee (JPL) Jonathan Lilly (NWRA) Timothy Liu (JPL) Susan Lozier (Duke) Jay McCreary (SOEST/IPRC) Vikram Mehta (CRCES) Chris Meinen (NOAA/AOML) Peter Minnett (U. Miami) Peter Rhines (U. Washington) Uwe Send (Scripps) C.K. Shum (OSU) FiammaStraneo (WHOI) John Toole (WHOI) Josh Willis (JPL) Carl Wunsch (MIT) Xiao-Hai Yan (U. Delaware) Jiayan Yang (WHOI) GokhanDanabasoglu (NCAR) Mike McPhaden (NOAA/PMEL) Young-Oh Kwon (WHOI) Patrick Heimback (MIT) Shenfu Dong (NOAA/AOML)
AMOC 2010 Annual Meeting June 7-9, 2010, Conrad Hotel, Miami FL Organizer: Tony Lee and George Halliwell http://www.atlanticmoc.org/AMOC2010.php Subpolar North Atlantic Workshop 2 April 14-16, Duke University Organizer: Susan Lozier South Atlantic MOC Workshop (SAMOC3) May 11-13, DHN, Niteroi, Rio de Janeiro Organizers: Silvia Garzoli, Alberto Piola, Sabrina Speich, Edmo Campos http://www.aoml.noaa.gov/phod/SAMOC/index_SAMOC3.html AMOC 2011 Annual Meeting joint with RAPID international conference: Past Present and Future Change in the Atlantic Meridional Overturning Circulation 12-15 July, 2011, Bristol, UK. Organizers: MericSrokosz, Val Byfield, Jessica Batchelor., David Legler, Cathy Stephens http://www.noc.soton.ac.uk/rapid/ic2011/ Meetings
Status: AMOC Observational Network U.S. Programs International Programs
Status: Export Pathways from the Subpolar North Atlantic PI’s: Amy Bower1 and Susan Lozier2 1 Dept. of Physical Oceanography, Woods Hole Oceanographic Institution, Woods Hole, MA 2 Earth and Ocean Sciences, Nicholas School of the Environment, Duke University, Durham, NC RAFOS floats launched from the subpolar gyre do not follow the DWBC continuously. Observations and modeling results show that eddy-driven flow creates an important interior pathway for newly-ventilated waters.
Status: AMOC Variability derived from ARGO and Altimetry PI: Josh Willis1 1 Jet Propulsion Laboratory, NASA, Pasadena, California ARGO data and altimetry can be combined to monitor AMOC variability at latitudes where the boundary circulations are weak (example: 41°N). ARGO-altimetry correlations provide an extended record back to 1993, suggesting a weak increasing trend at the subpolar-subtropical gyre boundary for the last two decades. MOC at 41ºN
Status: AMOC Variability in the subtropical Atlantic (RAPID-MOCHA 26.5°N) U.S. PI’s: B. Johns1, M. Baringer2,L. Beal1, C. Meinen21 RSMAS, University of Miami, Miami FL 2 NOAA-Atlantic Oceanographic and Meteorological Laboratory Continuous monitoring by the RAPID-MOCHA array has defined the average strength of the MOC at 26.5°N= 18.5 Sv, with a robust seasonal cycle of ±3 Sv. Correction of previous estimates based on hydrographic section data largely eliminates the apparent decreasing trend seen from the 1950’s onward. Bryden et al. (2005) MOC estimates with RAPID seasonal correction applied
Status: Relationship of Ocean Heat Transport to AMOC Variability U.S. PI’s: B. Johns1, M. Baringer2,L. Beal1 , C. Meinen21 RSMAS, University of Miami, Miami FL 2 NOAA-Atlantic Oceanographic and Meteorological Laboratory Mean heat transport: 1.33 PW At 26.5°N, the RAPID-MOCHA array now provides continuous ocean heat transport estimates of unprecedented accuracy. The mean value of 1.33 PW, larger than most previous estimates, is associated with a mean MOC strength of 18.5 Sv. This provides a precise definition of the relationship between MOC and heat transport variability, an important benchmark for climate model evaluation. Mean MOC:18.5 Sv Correlation: 0.94 Sensitivity: 0.06 PW/Sv
Southward limb of MOC MOVE array Status: AMOC Changes at 16°N: The MOVE Array PI: Uwe Send1 1 Scripps Institution of Oceanography, La Jolla, California Continuous measurements of the lower limb of the AMOC at 16°N suggest a small decreasing trend since 2000. Such measurements, combined with extended time series results from RAPID-MOCHA, ARGO/altimetry, and developing programs at other latitudes, will determine the degree of “connectivity” of AMOC variability throughout the basin.
Meridional Velocity and Transport Across AX18 PI: Shenfu Dong1, S. Garzoli2 and M. Baringer2 1CIMAS/AOML 2AOML Meridional velocity distribution for December 2004 transect. Cumulative volume transport (color), which reaches its maximum at 1300 m depth (black). Zonally averaged meridional velocity, and cumulative volume transport from sea surface to ocean floor. Strength of AMOC: the maximum cumulative transport (trans-basin integrated) from the sea surface to the ocean bottom, represents the total northward transport in upper water column.
Science Requirements: • Model-based observing system assessment • Complete observing system evaluation for subpolar N. Atlantic and S. Atlantic • Quantify impact of deep measurements in the interior North Atlantic (deep ARGO, full depth gliders) • Develop observing systems capable of examining meridional coherence of the AMOC and associated elements, including forcing functions. • Developing plans for putting judicious posterior error estimates on AMOC strength and variability estimates derived from ocean state estimation models. • Develop coordinated activity (including model development and observing system sensitivity studies) to examine special physics region such as high-latitude sinking regions. • Develop coordinated activity to examine water-mass transformation associated with AMOC and related air-sea interaction using modeling and assimilation systems. • Understand the reasons for differences - or biases- in the relationship between model MOC intensity and MHT in available models, as compared to observations. • Evaluate robustness of AMOC fingerprint in different models and consistency with observed fingerprint.
Science Requirements: Climate Impacts • Understanding the link between AMOC and SST variability: Study and better define the interaction between AMOC and upper ocean properties: SST, salinity, heat content. Understand the mechanisms of AMOC influence on SST and the possible role of upper ocean anomalies on generating (predictable) AMOC variability. There is a need to determine the phase relationships between the overturning circulation, the strength of the horizontal gyres, and the subsequent impact on SST. • Robustness of AMOC/AMV impacts and connecting impact studies to societal needs: While the number of studies on AMOC/AMV impact on world (particularly Northern Hemisphere) climate has increased and broadened, more should be done to establish the robustness of these links, understanding their cause, and comparing them to other long-term changes in climate, forced and natural. It is important to link these impact studies to societal needs and if relevant to actual sectoral decisions (e.g., in water resources, coastal infrastructure, health, and ocean resource management). This will help focus impact research and lead to tangible benefits from AMOC research. • Strengthen links to other related CLIVAR/WCRP activities: This will raise the profile of U.S. AMOC research and help in exchange of important information and stimulate progress. This goal can be achieved through U.S. CLIVAR, the International CLIVAR Atlantic Implementation Panel, and through communication with individual program committees, nationally and internationally.
Science Requirements: • AMOC Mechanisms and Predictability • Study AMOC and MHT relationships in models (forward, assimilation, eddy- permitting) in comparison with the RAPID data • Inter-comparison of near-term prediction experiments (AR5) to investigate robustness of model simulations • Inter-comparison of hindcast ocean-only and ocean-ice coupled simulations forced with the CORE-II inter-annual data sets to assess the robustness of model simulations under specified forcing • Develop new observations & synthesis of existing observations to discriminate against proposed mechanisms, including synthesis of proxy data • Study impact of model biases, e.g., Gulf Stream and North Atlantic Current paths, on AMOC variability and predictability • Focus studies between modeling groups for AMOC mechanisms • Identify “best” initialization practices for decadal prediction simulations • Investigate impacts of high resolution (0.1°) on AMOC variability • Identify standard metrics
AMOC Monitoring Strategy Science Requirements: • Establish discrete set of trans-basin arrays (moorings + autonomous profiling) for continuous AMOC estimates • Value: • Accurate multi-year mean AMOC estimates, for comparison with future (and past) AMOC states • Understandingof processes underlying short-term (intraseasonal to annual) variability • Benchmarks for evaluation of modeled AMOC variability (GCMs, data synthesis models) O-SNAP RAPID MOVE SAMOC Lumpkin and Speer (2007)
The third workshop for the South Atlantic Meridional Overturning Circulation (SAMOC 3) took place in Niteroi, Rio de Janeiro, Brazil on May 11-13, 2010. The Agenda, the list of participants, copies of the presentations and details on the observational plans can be obtained at: www.aoml.noaa.gov/phod/SAMOC/. Current plans for observations in 2010 and 2011 and recommended observations (Green rectangles). Solid black line: Moored instruments Black circle: planned Ocean Observatory. Blue lines: CTD lines. Dashed green lines: XBT lines, are repeated quarterly with the exception of the line GoodHope line (twice a year during the southern Hemispheric summer). Yellow lines: transit lines conducted every year and can be made available for Argo float deployments or any other observation.
Numerical model studies completed in the United States, the United Kingdom, and in Brazil, as well as theoretical studies in the Netherlands, indicate that the higher latitudes (30S to 34.5S) are likely to produce more robust estimates of the MOC for several reasons. • First and foremost, higher latitudes provide stronger density gradients, leading to improved signal-to-noise characteristics for geostrophic velocity calculations. • Secondly, the strongest signals are more tightly confined to the boundaries at higher latitudes, particularly the eastern boundary, meaning the more intensely sampled array can be done in a smaller region. • Thirdly, the measurement of the stability of the MOC, a crucial factor in attribution of observed signals, is more favorable at higher latitudes. • The community recommendation is that a SAMOC monitoring array be located between 30 and 34.5S, and that it involves 10-20 deep ocean moorings, a combination of tall moorings and pressure-equipped inverted echo sounders, coupled with several shorter direct velocity moorings on the shelf on either side of the basin. • Furthermore, attribution of the observed signals at 30-34.5S will require concurrent observations from Drake Passage and in the passage between Africa and Antarctica. Therefore, maintaining and augmenting the existing arrays in those areas will be crucial for success. Black is AMOC from OFES from V; Blue is reconstruction from a perfect T, S array, Red from a CPIES array (R. Perez)
AMOC Program near term goals: 1. Observations Overturning in the Subpolar North Atlantic Program (OSNAP) Subpolar To quantify the large-scale, low-frequency, full water-column net fluxes of mass, heat and fresh water associated with the meridional overturning circulation in the subpolar North Atlantic. Cape Farewell (UK) Soft Lines: floats/gliders (US, ohers) Ellett Line (UK) Reykjanes Ridge (FR) 53°N (Germany)
Design elements: O-SNAP Red lines: Boundary monitoring partially implemented. The two red lines are (i) the German Labrador Sea Exit array, which would need to be extended both to near-surface and inshore on the shelf, and (ii) the Ellett Line, which needs improved temporal and spatial measurement density. Blue line: Approximate location of a possible Mid-Atlantic Ridge array. Green line: Site of past boundary monitoring: not presently in the water. The green line is the location of the UK DWBC and French EGC arrays, in the water between 2004 and 2008. Some engineering development is required to enable robust shelf monitoring here. Proposed seaward termination of this line is the planned OOI Irminger Sea Global-Scale Node (GSN) at 60°N, 39°W. Yellow lines: Ocean regions to be monitored by “soft” arrays, comprising of a mixture of gliders, floats, possibly deep T/S moorings, BPRs and bottom current meters. The observing design for the interior needs further study to assess the mix of instrumentation that can most efficiently accomplish the needed spatial and temporal coverage. O-SNAP Cape Farewell (UK) Soft Lines: floats/gliders (US, ohers) Ellett Line (UK) Reykjanes Ridge (FR) 53°N (Germany)
Issues: • Funding: • NOAA AMOC program supposed to provide 5 million/year, matching NSF and NASA investment • Likely NSF will contribute support for Subpolar gyre observations • Shiptime • SAMOC shiptime coordinated with international partners (but not necessarily free) • Decreasing shiptime support for existing programs WBTS and MOVE