Download
1 / 19
200 likes | 332 Views
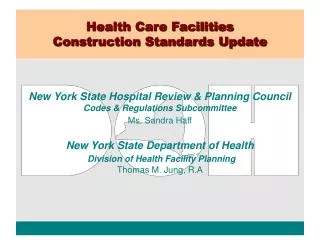
FACILITIES PLANNING & OPERATIONS “Facilities Update” April 20, 2010. 1. 12. 22. 33. 2. 13. 23. 34. 3. 14. 24. 35. Chief Engineer. 4. 15. 25. 36. 5N. 5/6. 16. 26. 37. 7. 17. 27. 38. Senior Engineer. 8. 18. 28. 39. 9. 19. 29. 43. 20. 10N. 10. 30. 44. 21. 11.

E N D
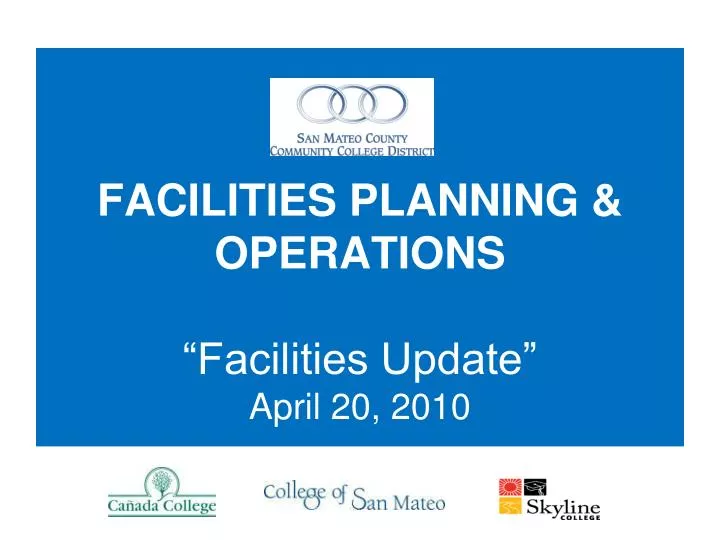
FACILITIES PLANNING & OPERATIONS“Facilities Update”April 20, 2010
1 12 22 33 2 13 23 34 3 14 24 35 Chief Engineer 4 15 25 36 5N 5/6 16 26 37 7 17 27 38 Senior Engineer 8 18 28 39 9 19 29 43 20 10N 10 30 44 21 11 Maintenance Engineer 31 DO JANUARY 2010 AUGUST 2009 APRIL 2009 JUNE 2008 JANUARY 2008 JULY 2011 JANUARY 2009 TOTAL SQ. FT = 554,243 79,177 PER ENGINEER TOTAL SQ. FT = 565,719 94,286 PER ENGINEER TOTAL SQ. FT = 548,605 91,434 PER ENGINEER TOTAL SQ. FT = 627,832 89,690 PER ENGINEER TOTAL SQ. FT = 550,869 78,696 PER ENGINEER TOTAL SQ. FT = 653,719 93,388 PER ENGINEER TOTAL SQ. FT = 724,581 103,511 PER ENGINEER Utility Engineer
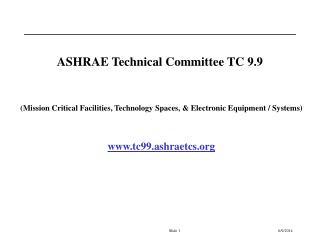
1 3E 10 19 Chief Engineer 2 4N 11N 20 3 5 14 21 3A 6 15 22 Senior Engineer 3B 7 16 23 3C 8 17 24 3D 9 18 Maintenance Engineer JANUARY 2008 JANUARY 2011 AUGUST 2009 MAY 2010 Total Sq Ft = 469,985 78,331 per Engineer Total Sq Ft = 542,984 90,497 per Engineer Total Sq Ft = 462,985 77,164 per Engineer Total Sq Ft = 446,985 89,397 per Engineer Utility Engineer
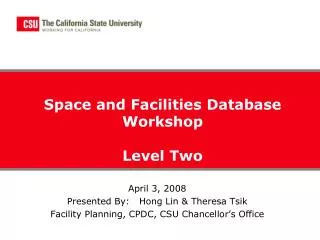
1 13 2 16 Chief Engineer 3 17 5 18 6 19 Senior Engineer 7 20 8 21 9 22 Maintenance Engineer JANUARY 2008 JULY 2009 AUGUST 2008 DECEMBER 2008 MAY 2009 TOTAL SQ. FT = 287,787 71,947 PER ENGINEER TOTAL SQ. FT = 303,506 75,876 PER ENGINEER TOTAL SQ. FT = 296,856 74,214 PER ENGINEER TOTAL SQ. FT = 303,506 75,876 PER ENGINEER TOTAL SQ. FT = 345,301 86,325 per Engineer Utility Engineer
1 12 22 33 2 13 23 34 3 14 24 35 Lead Custodian 4 15 25 36 5/6 5N 5/6 16 26 37 Day Shift Custodians 7 17 27 38 8 18 28 39 9 19 29 43 10N 10 20 30 44 11 21 31 DO APRIL 2009 JUNE 2008 AUGUST 2009 JANUARY 2010 JULY 2011 JANUARY 2009 JANUARY 2008 CSF = 491,232 30,702 PER FTE CSF = 455,546 28,471 PER FTE CSF = 464,088 30,939 PER FTE CSF = 452,749 30,183 PER FTE CSF = 451,858 30,124 PER FTE CSF = 541,714 36,114 PER FTE CSF = 598,385 39,892 PER FTE Swing Shift Custodians
1 13 2 16 Lead Custodian 3 17 5 18 6 19 Day Shift Custodian 7 20 8 21 9 22 Swing Shift Custodian AUGUST 2011 JANUARY 2008 AUGUST 2008 DECEMBER 2008 MARCH 2009 MAY 2009 AUGUST 2009 CSF = 223,339 20,303 PER FTE CSF = 217,935 19,812 PER FTE CSF = 217,935 21,793 PER FTE CSF = 223,935 22,393 PER FTE CSF = 227,705 25,300 PER FTE CSF = 229,292 20,844 PER FTE CSF = 254,500 28,278 PER FTE
1 3E 10 19 Lead Custodian 2 4N 11N 20 3 5 14 21 3A 6 Day Shift Custodian 15 22 3B 7 16 23 3C 8 17 24 3D 9 18 Swing Shift Custodians MAY 2010 JANUARY 2011 AUGUST 2009 JANUARY 2008 JANUARY 2010 CSF = 395,782 28,270 PER FTE CSF = 411,813 31,678 PER FTE CSF = 417,605 29,829 PER FTE CSF = 395,782 28,270 PER FTE CSF = 478,395 34,171 PER FTE
JANUARY, 2008 151 Acres / 7 = JANUARY, 2009 146 Acres / 6 = January, 2010 146 Acres / 6 = JULY, 2011 147 Acres / 6 = Lead Groundskeeper 24.5 22 24 24 Groundskeepers
JANUARY, 2008 105 Acres / 3 = JANUARY, 2011 104 Acres / 3 = 35 35 Lead Groundskeeper Groundskeepers
JANUARY, 2008 128 Acres / 3 = AUGUST, 2009 128 Acres / 3 = 43 43 Lead Groundskeeper Groundskeepers
New/Additional FPO Expenses • Custodial Supplies • Paper products • Non-paper products • Maintenance Supplies • Air filters • Fan belts • Batteries • Lighting (interior and exterior) • Universal Network Controllers (UNCs) • Testing and Certifications • Every 5 years • Fire Sprinkler and Backflow Certification • Electrical Load Center Certification • Every year • Fire Pump Testing and Overhaul • Fire Extinguisher Inspections • Rollup Door Inspections • Elevator inspections/permits
Scenario – Cañada College • Chiller – from $1500 per year for water treatment of the old chiller, it’s increased to around $12K per year for the new one; plus new annual maintenance/service agreement of $10K • Air filters for air handling units – increased from 19 to 42 = additional$6K for semi-annual change; or $12K for required quarterly change • V-belts for air handling units – exhaust fans has increased from 52 to 72 = additional $2500 per year • Batteries for fire life safety devices and ACAMS – roughly additional $5K per year • Lighting – 130 new parking lot and walkway lights installed = roughly additional $3K per year to replace fixtures
Recurring Maintenance Costs • Maintenance and Service • Fire, Life and Safety Systems • Access Controls and Video Surveillance Systems • Co-generators • Building Management System • Elevators (additional elevators) • Chillers • Boilers