Download
1 / 32
330 likes | 399 Views
Disability free life expectancy (DFLE) in the European Union from 1995 to 2003 using the European Community Household Panel (ECHP). EUROSTAT DEVELOPMENTS. Structural indicators : background & inclusion of health issues.

E N D
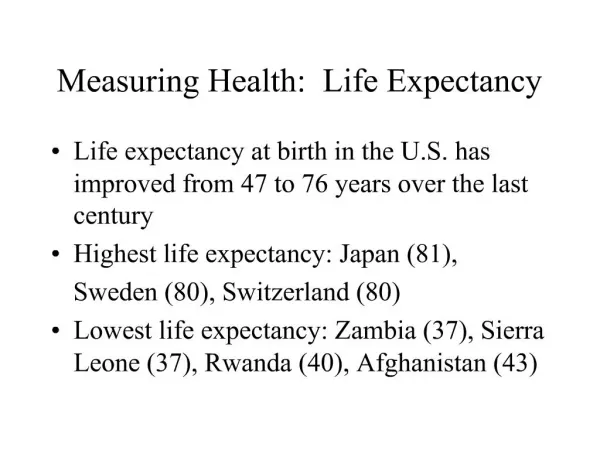
Disability free life expectancy (DFLE) in the European Union from 1995 to 2003 using the European Community Household Panel (ECHP)
Structural indicators : background & inclusion of health issues • 23-23/03/2000 : Lisbon European Council invited “the Commission to draw up an annual synthesis report on progress on the basis of structural indicators (SI) relating to employment, innovation, economic reform & social cohesion” • SI are proposed by policy DGs, the methodologydeveloped using recognised methods & when necessarywith support of academic experts, their values calculated, stored (SI database) & disseminated by Eurostat (validation by MS) • 2003 : shortlist of headline indicators + public database (large number of indicators to fully monitor structural reforms) • 08/12/2003 : according to the EU Sustainable Development Strategy & the 6th Environmental Action Plan, Council conclusions request : indicators on biodiversity & health need to be included in the SI database
Structural indicators :inclusion of HLY-DFLE as 1rst health indicator • July 2003 : support of DG SANCO Network of Competent Authorities • 08/10/2003 : Commission Communication COM(2003) 585 final on SI included in part “indicators under development” the “healthy life years” (HLY-DFLE) • 26-27/11/2003 : information of the Eurostat WG on Public Health statistics meeting • 21/01/2004 : Commission COM (2004) 0029 - report from the Commission to the Spring European Council delivering Lisbon reforms for the enlarged Union : priority to examine possibilities for integrating Public Health into the Lisbon strategy by 2005, as a contribution to growth & sustainable development
HLY-DFLE : definition & methodology • Health expectancy = number of years that a person of a specific ageis still expected to live in a healthy condition; breakdown by gender • The Sullivan method combines information on mortality & morbidity, i.e. it is a LE calculation weighted by morbidity prevalence : • information on mortality from life tables : age-specific probability of dying (Eurostat demographic statistics) • information on morbidity is based on prevalence measures of the age specific proportion of the population in healthy and unhealthy conditions • For HLY,healthy condition defined by the absence of limitations in functioning / disability; consequently it is also called disability-free life expectancy (DFLE) • HLY-DFLE as SI is calculated at birth
HLY-DFLE : Eurostat activities for the development of this structural indicator • Eurostat data sources on limitations in functioning / disability : • Minimum European Health Module (MEHM) in the Statistics on Income and Living Conditions survey SILC carriedout from (2003)/2004/2005 depending on MS • For 1995-2001, use of the similar variable in the European Community Households Panel (ECHP) for EU15 (excl. LU) • 1rst half 2004 : on the basis of the 2003 requirements & supports as well as sources above, Eurostat D/6 : • took overthe existing methodology (Sullivan method) • extracted input data from ECHP & assessed its quality, • prepared documentation & computed initial values 1995-2001
HLY-DFLE : Eurostat activities for the development of this structural indicator • 20/04/2004 & 01/07/2004 meetings of Commission interservice group on SI : Eurostat development (support by SANCO C/2 leader, + EMPL + ENV) acknowledged; however, the group stated that the inclusion of HLY-DFLE in the SI was subject to 2 conditions : • preparation of a “quality profile” on assessment & validation of the quality & methodology of the indicator • data should be provided for 2002 & as much as possible 2003 (SI timeliness minimum requirements) • 19/07/2004 letter sent to all national representatives in the Eurostat WG on Public Health statistics : • draft “quality profile” • draft values of the HLY calculated by Eurostat from the ECHP data over the period 1995-2001 for the EU15 Member States (excluding LU)
HLY-DFLE : Eurostat activities for the development of this structural indicator • Asking, by 20/08/2004, for : • agreement on the document “quality profile” • validation on the national data 1995-2001 (EU15 MS) • suggestions concerning national data for new MS • suggestions concerning 2002 & if possible 2003 • Answers : high support; problems only for some national values; no solution for missing data • 31/08/2004 : Meeting EHEMU-Eurostat-SANCO • calculation by EHEMU of estimates on 2002 & 2003 and for the few problematic values on the basis of trends 1995-2001 in the limitation prevalences or mortality data (high inertia in evolutions) • Calculation of HLY by Eurostat for new MS/EFTA national sources when sufficiently comparable; also EU15 aggregate (i.e. EU14 excl. LU)
Adoption & state of play on provision of HLY-DFLE data by Eurostat • Final discussions within the SI interservice group & with Council in 09/2004HLY ADOPTED by Communication to the Commission on 14/10/2004 in the SI data base for report to 2005 Spring EU Council • Quality report officially approved by MS in 11/2004 • final check & improvements of calculations with EHEMU, final preparation of metadata documents (“SDDS”) in 12/2004 • Data already available in Eurostat web-site (ex-Newcronos) in the sections of SI & public health
Eurostat calculations • EU15 MS (excl. LU) 1995- 2001 ECHP data from variable PH003A : • “are you hampered in your daily activities by any physical or mental health problem, illness or disability ?” • severely / to some extend / not limited” • available for people in sample 16 years old & over • 5 new MS + NO, different sources : • 18 HIS items (2002/2003): CZ HU CY MT PL(1996) • others : PL 2002 census, NO 2003 pilot SILC • data from EE & LV not used (not sufficiently comparable ?) • Aggregate EU15 (EU14) using the ECHP double weights : sample + « EU » weight (sample population level)
Eurostat calculations • HLY as structural indicator is calculated at birth but the value have also been calculated (according to ECHP age breakdown) at 15, 20, 25, … 70, 75, 80, 85, 90+ years; are disseminated in the Eurostat web site : • Values in years at birth (SI part of reference database) • values in years & in % of LE, both at birth & at 65 years (« health » part of reference database) • Corrections needed for few countries : DE & UK due to use of another source than ECHP to provide “ECHP” health data from 1997 onwards, also some difficulties for probabilities of dying for few countries & years, etc. EHEMU estimates; • EU15 (14) aggregate calculated only when having received corrected values from EHEMU for the relevant MS / years
Eurostat calculations • Assumptions made : • average limitations/ disability prevalence0-14 years old supposed to be half of the ECHP prevalence of the next age group (16-19 = 15-19) • institutional households are not included in the ECHP, i.e. it is assumed that the population living in private households is representative for the total population : not significant at birth (but effect at old ages) • Some sample size issues or missing values (prevalence or mortality) for very old ages corrections or assumptions made (e.g., Log. regression, life expectancy at the last age taken from another year, etc.)
HLY-DFLE on ECHP 1995-2003 :comparability restrictions • Cultural differences from country to country : same questions on limitation / disability might be interpreted differently from a country to another one • No common survey instruments in the new MS : comparability among them as well as between them and the EU15 Member States is restricted • However restrictions on the comparability across countries apply on the “level” of the HLY-DFLE but not on its evolution • Due to transition between end-ECHP and start-EU-SILC, there will be breaks in series between 2003 & 2005, the extent to be examined once the data have become available
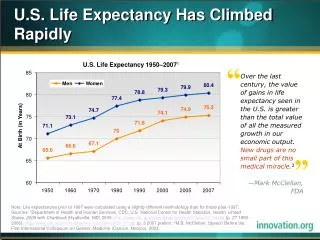
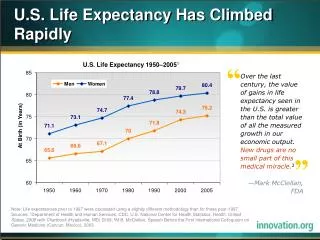
HLY-DFLE on ECHP 1995-2003 : main results • In EU15 in 2001 : • women could expect to live to 65.0 years … • women 65 years old could still expect to live 19.9 years of which 10.4 (52%) … • men to 63.6 years … • men65 years old could still expect to live 16.3 years of which 9.9 (61%) … … without any limitation / disability • In EU15 over the period 1999-2001 HLY-DFLE at birth : • increased from 63,9 to 65,0 years for women (about 79% of LE) • from 63,2 to 63,6 for men (84% of LE)
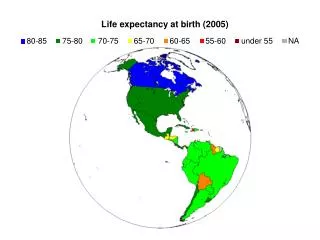
HLY-DFLE on ECHP 1995-2003 : main results • HLY-DFLE in 2003 ranged : • less than 60 years in Hungary, the Netherlands (women only), Portugal (men only) and Finland • to more than 70 years in Italy • In % of LE, over the period 1995-2001, HLY-DFLE at birth : • increased of 2,7% in BE & IT for women • and more than 3% in BE & DE for men • but decreased - 4,9% in NL for women • and - 2,8% in PT for men • But cultural effects, better comparability with SILC data in future
Data and Methods • Estimation of Life Expectancy (LE) and 95% CI • Estimation of DFLE and 95% CI, using Sullivan method • age specific probability of death • age specific disability prevalence
Data and Methods Problems in both mortality and the panel data Solutions • 1) Data base • Probable data errors • Replacement with other sources • Missing • 1) Data base • Linear imputation of age specific probabilities according to trends Example… • 2) Interruption of data collection • No data for 2002 and 2003
Ex: Female LE at age 65 in UK • Imputation of age spercific probabilities according to observed trends
Data and Methods • Problems in both • mortality and the panel data • 1) Data base • Probable data errors • Replacement with other sources • Missing • Solutions • 1) Data base • Linear imputation of age specific probabilities (death and disability) • Shift of the prevalence trend to the ECHP level • Imputation of data according to observed trends Example… • 2) Interruption of data collection • No data for 2002 and 2003
Ex: Female LE at birth in Denmark • Linear imputation of missing probabilities of death
Data and Methods • Problems in both • mortality and the panel data • 1) Data base • Probable data errors • Replacement with other sources • Missing • 2) Interruption of data collection • No data for 2002 and 2003 • Solutions • 1) Data base • Linear imputation of age pecific probabilities (death and disability) • Shift of the prevalence trend to the ECHP level • Imputation of data according to observed trends • 2) Interruption of data collection • Linear extrapolation of the disability prevalence Example…
Ex: Male disability prevalence in Greece (65 years and older): • Linear extrapolation of the disability prevalence up to 2003
Example: Trends in LE and DFLE at age 65, 1995-2003, Male, Austria Main results
Trends in LE and DFLE at birth in European countries, 1995-2003 Male
Trends in LE and DFLE at birth in European countries, 1995-2003 Female
85.00 LE DFLE 80.00 SWE 75.00 70.00 65.00 60.00 55.00 Males Females sex Distribution of life and disability free life expectancy EU (14), 2003
Trends in the percentage of expected life free of disability at bith Austria, 1995-2003 Female population
AUT, BEL, DNK, ITA, ESP, SWE FIN, FRA, GBR DEU, GRC, IRL, NDL, PRT Trends in expected life free of disability at age 65
GRC, NDL, PRT, GBR DNK, SWE Trends in expected life free of disability at age 65 AUT, BEL, FIN, FRA, DEU, IRL, ITA, ESP
Trends in DFLE using the ECHP Some conclusions • Life expectancy: • Small variation in life Expectancy between these 14 MS • increase over 1995-2003 • 2) Disability Free Life Expectancy and % of years free of disability • Large variation between these 14 MS • Diverging trends over 1995-2003: reduction / stagnation / increase in the expected life with reported disability while LE increases 3) Gender differences in DFLE trends in some countries 4) Gender differences in DFLE are smaller than gender differences in LE
Trends in DFLE using the ECHP Issues and inference • The population aging has a different impact in • the 14 european populations: • - different levels of reported disability (larger dispersion than LE) • - variation in the magnitude of the gender difference • - different trends over time • Need to further document cross-national differences • in self-reported disability: • - improved harmonisation of the instruments • - using different levels of severity (SILC) • - documenting differences in reporting • - documenting differences in selection in the panel • …