Download
1 / 16
160 likes | 716 Views
2-D Gas Chromatography (or 3D with MS Detector). A powerful separations tool for complex volatile mixtures of heat-stable samples [information shamelessly taken from Wikipedia and other sources – see last slide]. History. Comprehensive 2-D gas chromatography (GC) (abbreviated GC X GC)

E N D
2-D Gas Chromatography (or 3D with MS Detector) A powerful separations tool for complex volatile mixtures of heat-stable samples [information shamelessly taken from Wikipedia and other sources – see last slide] Wilkes University - CHM 341
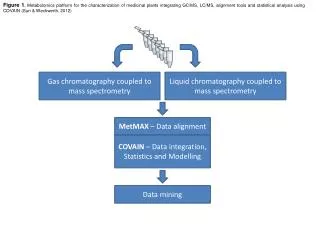
History • Comprehensive 2-D gas chromatography (GC) • (abbreviated GC X GC) • a mature technique with commercial products on the market • technique has tremendous separation power • uses simple robust hardware • similar analysis times to temperature-programmed high-resolution capillary chromatography • Comprehensive 2-D LC (LC X LC) • still in its infancy • more complex to perform • driven by user needs, especially in proteomics
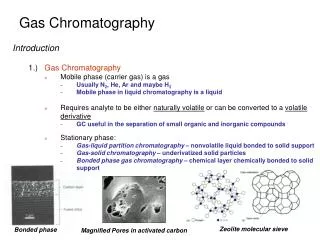
The Concept • additional physico-chemical criterion employed for the separation of the mixture of analytes (sample) • resolution and quality of chromatographic separation can be increased • higher specifity of the separation capability is obtained • separation of compounds indistinguishable by 1-D chromatography • Gas-Phase Chromatography, 2-D [an illustrative example] • coupling a second, short column to the first long column • shock-freeze eluents in order of elution from the 1st column • reheat them in order of elution for release into the 2nd column • transit time through the 2nd column needs to be shorter than the time until the next sample is reheated & released • Gas-Phase Chromatography, 2-D [an illustrative example] • one column is used to separate analytes • followed by Time-of-Flight Mass Spectrometer (TOFMS) detection as the second dimension • TOF-Mass Spectrometers used in gas chromatography can be very short [ due to the limited range of m/z required]
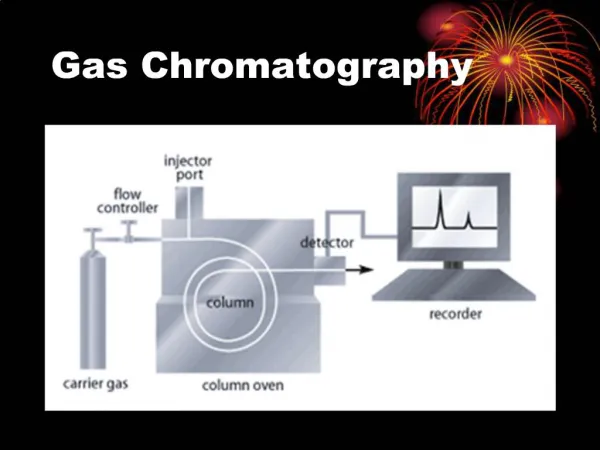
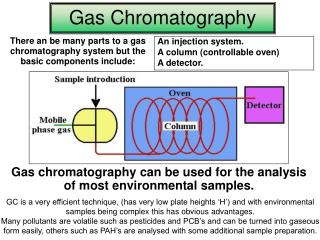
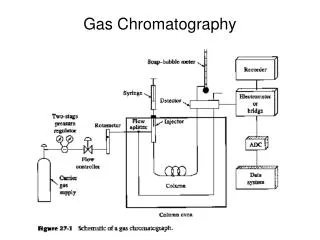
The Instrument Requirements • two pieces of hardware are added to a conventional GC • a second column • an interface between the second column and the first (the modulator) • the time for analysis on the second column is very fast (short column) • the interface repetitively samples the effluent from the first column, and injects it onto the second
The Instrument Requirements • Rt on the two columns may be thought of as lyingperpendicular to one another • 2nd column stationary phase different from the 1st • retention mechanism different from that of the 1st • retention mechanism are “uncorrelated”, “independent”, or “orthogonal” • molecules are separated on the basis of independent chemical properties in the 1st and 2nd columns • Ex. 1st column separates based on the basis of “molecular size” (volatility/b.p.) • 2nd column separates on the basis of polarity • the molecular property “polarity” is largely independent of the molecular property “size,” or volatility • Polar funct. groups can be attached to compounds of any size
The Instrument Requirements • Modulator performs 3 tasks (in repetitive cycle): • accumulates sample eluting from 1st column • period of time equal to 1/3 to 1/5, of the duration of an individual peak from the first column • Ex. a first column peak is 9 seconds wide at the base: modulator will accumulate material every 2 (or 3) seconds, thereby “chopping” the peak eluting from the first column into “cuts” • focuses the material collected from each cut into a narrow “band”, “plug”, or “chemical pulse”. • by flash-freezing (with, for ex., a cold jet of CO2) • “launches” or injects the sharp chemical pulses sequentially onto the second column • a series of high speed gas chromatographic separations occur • one separation for each chemical pulse launched onto the second column
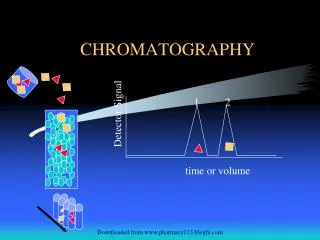
Data interpretation • each vertical column of the image may be integrated and plotted as a function of 1st column elution time • the conventional gas chromatogram, or “first-dimension chromatogram,” appears • scanning downward from each “peak” in the first dimension chromatogram, one can count the number of coeluents, • visible as discernable second-dimension peaks, of which the conventional one-dimensional peak actually consists
Data interpretation • Most of the colored spots -- the chromatographic peaks -- in images such as Figure 4 (above) are believed to represent one, or a very few, of the chemical species present in the sample. • In the case of the diesel oil appearing in Figure 4, some 5,000 peaks are discernable. • Even with this very high peak count, co-elutions still occur at the higher carbon number region on the right hand side of the image. Nonetheless, valuable information is still available from rich and chemically significant peak patterns. • In the example of Figure 4, chemical classes are clearly visible. • Column bleed products eluting from the first column are also clearly distinguishable from the sample matrix. • Diagonal sub-bands appear throughout the chromatogram, corresponding to groups of isomers – the so-called “roof-tile” effect.
Data interpretation – the 3rd D • Liver – Drug induced damage
For more info . . . • Visit Zoex Corporation for info taken from their technical note http://www.zoex.com/technote_kt030505-1.html • LECO Corporation – product flyer PegasusHT http://www.leco.com/products/sep_sci/pegasus_ht/pegasus_ht.htm • LECO Corporation – technical notes http://www.leco.com/resources/application_note_subs/separation_science_application_notes.htm • Visit this site for info on comprehenisive LCxLC http://www.chromatographyonline.com/lcgc/article/articleDetail.jsp?id=187969