Download
1 / 19
190 likes | 298 Views
10: MR spectroscopy. How can the Bloch equations be used to describe the effect of T 1 on the magnetization ? How can sensitivity be optimized ? What nuclear property allows to distinguish the signal from different molecules ? What is MR spectroscopy ?. After this week you

E N D
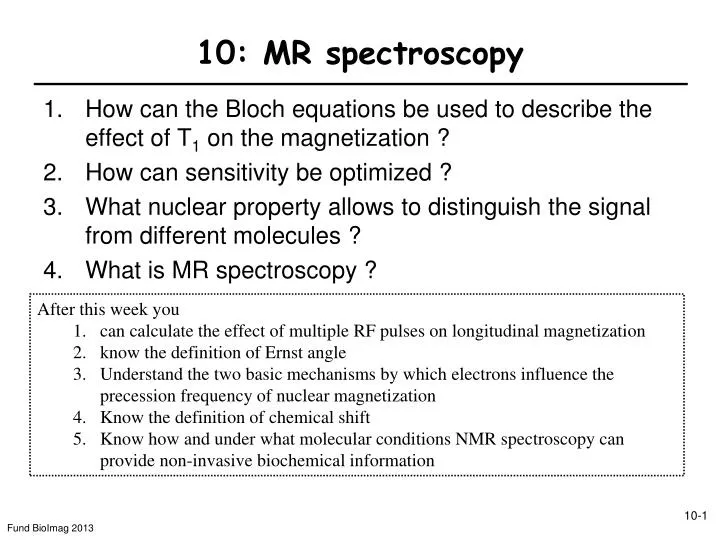
10: MR spectroscopy • How can the Bloch equations be used to describe the effect of T1 on the magnetization ? • How can sensitivity be optimized ? • What nuclear property allows to distinguish the signal from different molecules ? • What is MR spectroscopy ? • After this week you • can calculate the effect of multiple RF pulses on longitudinal magnetization • know the definition of Ernst angle • Understand the two basic mechanisms by which electrons influence the precession frequency of nuclear magnetization • Know the definition of chemical shift • Know how and under what molecular conditions NMR spectroscopy can provide non-invasive biochemical information
Fat suppressed breast MRI (cancer does not contain fat) Retrobulbar fat Fat and water in MRI: Examples Fatty liver
Why is NMR spectroscopy important for (bio)chemists ? • Routine tool • Non-destructive analysis of samples • Wine in bottles • Synthesis outcome control • Other applications • Structure determination in solution • Molecule dynamics • Chemical reactions in situ Insert sample Kurt Wüthrich Biophysicist, 2002 Analyze data Determine structure
10-1. What is the effect of relaxation on M(t) ?Bloch equations revisited T1 T2 The effect of T1 and T2 on the signal : flip angle a = gB1t: TR, TI a Effect of T2 Mz(0) Mxy(0) Effect of T1 Longitudinal coherence Longitudinal coherence: Effect of T1 on signal depends on prior RF manipulations
What are the optimal conditions to measure T1 ?Inversion recovery Inversion-Recovery Multipulse experiment with two RF pulses Usual experiment to measure T1 (a=p) Optimal choice of a for measuring T1 ? Use noise error propagation calculation (Lesson 1) a p/2 TI sina=0 a=p Converts Mz to Mxy (signal) Measured signal Optimal t=TI to detect changes in T1? TI = T1
Situation: RF pulses a applied every TR seconds n times Question: Mxy (=signal) maximal ? Calculate the optimum flip anglea=f(TR) 10-2. When is SNR (sensitivity) optimal ? TR a a Mz(n) Mz(n+1) Mxy(0) Mz(0) Immediately after nth TR Assume Mxy=M~0 after TR seconds After RF Flip a After T1 recovery In equilibrium (steady-state condition): Mz(n+1)=Mz(n)=Mz Equilibrium transverse Magnetization: Mxy(0)=Mzsina
How does the signal depend on TR, T1 and flip angle ?Ernst Angle aE aE Richard Ernst Physical Chemist 1991 Ernst Angle vs TR/T1 Mxy (signal) → maximum at aE dMxy/da=0: Where aE = Ernst Angle
10-3. What role does the chemical environment play?Chemical shift: Effect of B0 on e-cloud Resonance frequency of the pure proton: H wL=gB0 (Larmor frequency) Proton: nucleus of 1H B0 DB=dB0 H H Reorientation of e cloud in magnetic field: e produce a small magnetic field DB at the proton: w=wL(1+d) Proton + e cloud: 1H atom Nearby electronegative atoms (e.g. O, Cl): attract electrons → lower electron density → deshielding of nearby H Chemical shiftd H OH CH → Resonance frequency is higher in OH than CH H C H H O More shielding Hydrogen e- Little shielding
How is chemical shift d linked to electronegativity ?Example: Protons 0 ppm is defined by resonance frequency of reference compound wLref(e.g. tetramethylsilane (TMS) for 1H) d=(w-wLref)106/wLref
10-4. How can we measure chemical shift ?MR spectroscopy • Free induction decay (FID) signal: • distinguish resonance frequency • → Fourier transformation (real part only): • Area of resonance M(0) number of nuclei concentration (if relaxation can be neglected) Example: Ethanol w=d Integral (area) Ratio: 1:2:3 (relative number of spins in molecule) 3 1/pT2 2 1
H ↑ ↓ H Ex. illustration of chemical proximity (triplet & quartet) Example: Ethanol Hyperfine splitting nucleus tiny magnetic field linked to its dipole: changes polarity if spin is “up” or “down” affects the e cloud in the molecule→ alters the magnetic field at a nearby nucleus: 2 1 1 3 3 B0 1 1 Nearby spin-1/2: 1H resonance will split into two of equal magnitude (doublet) e- cloud nuclear spin-induced field CH2 group → four combinations (with equal probability): up-up, down-down, up-down, down-up (The latter two produce the same magnetic field)→ methyl triplet (relative intensity ratio 1:2:1)
Ex. 31P NMR spectroscopyPhosphate metabolism is at the heart of cellular energetics 1 23 13,14 24 15,22 25 1: phosphocreatine (PCr) 13: phospho-ethanolamine (PE) 14: phosphocholine (PC) 15: glycerophosphocholine (GPC) 22: glycerophosphoethanolamie(GPE) 23: ATP 24: inorganic phosphate (Pi) 25:dinucleotides (NAD(P)[H]) Also measured: Intracellular pH Creatine kinase activity ATPase activity
What can MR spectroscopy measure ? • Concentration of biochemical compounds • signal is proportional to the number of spins present, i.e. concentrationAfter FT, integrate (measure the area of the peak). • Rules for a compound to be detectable: • Concentration > 1mM • Water-soluble compounds (mobile) • 1H is most sensitive nucleus (gyromagnetic ratio) Spatial Resolution Voxel volume ~ 1/Signal Water (80M 1H concentration) ~1mm (human) ~50µm (rodent) Biochemical compounds (~mM concentration) ~ cm (human) ~ mm (rodent) Why is spatial resolution better for rodent studies ? Induced emf z depends on RF coil size (Lesson 9)
How can the huge water signal be suppressed in 1H NMR ? suppression Water + Phe Full signal (no suppression) Scaled signal (no suppression) Scaled signal (with suppression) water fat • NB. Resonance suppression: • Minimize Mz : “selective” 900 pulse applied on-resonance on the signal to be suppressed. • Selectivity achieved by using weak B1 (lecture 9), i.e. long RF pulse. • 900 (selective) followed by a0 for excitation and detection [assume the suppressed signal is dephased (see Lecture 11)] a 900 Mz(water)=0
5 4 3 2 1 Ex. Proton spectroscopy of the brainBiochemical compounds detectable in vivo Energy metabolism: 1: phosphocreatine (PCr) 2: creatine (Cr) 3: glucose (Glc) 4: lactate (Lac) 5: alanine (Ala) Neurotransmission: 6: glutamate (Glu) 7: glutamine (Gln) 8: GABA 9: N-acetyl-aspartyl-glutamate (NAAG) 10: aspartate (Asp) 11: glycine (Gly) 12: serine (Ser) 16 1,2 9 14,15 2 6,7,18 19 1 6 Incompletely suppressed H2O signal 17 8 8 17 11,20 4 6,7 21 7 12,13 16 5 20 3 16 14,15 10 3 (ppm) Antioxidants/osmolytes: 17: glutathione (GSH) 18: vitamin C (Asc) 19: taurine (Tau) 20: myo-inositol (Ins) 21: scyllo-inositol (s-Ins) Membrane metabolism: 13: phospho-ethanolamine (PE) 14: phosphocholine (PC) 15: glycerophosphocholine (GPC) 16: N-acetyl-aspartate (NAA)
residual fit Glu Gln NAA Lac 4.5 4.0 3.5 3.0 2.5 2.0 1.5 1.0 ppm How can biochemical compounds be measured in vivo ?Analysis of 1H NMR spectroscopy of the brain in vivo
Ex. Metabolic phenotyping of transgenic animalsR6/2 mouse (human Huntingtin gene knockin) at wk 8 16 N=7 Wild-type HD transgenic 14 Standard deviation 12 10 8 concentrations (µmol/g) 6 4 2 0 Cr PE Ins Glc Ala Gln Glu Asp PCr Lac Tau NAA GSH GABA NAAG
Example: Human brain and muscle Muscle Brain tumor 1H 31P
Ex. 1H NMR spectroscopy in vivoMouse brain Mouse model of stroke Mouse model of human glioma