Download
1 / 133
1.43k likes | 1.89k Views
Organic Chemistry Laboratory. Building A Toolset For The Identification of Organic Compounds. Spectroscopy. The Absorption of Electromagnetic Radiation and the use of the Resulting Absorption Spectra to Study the Structure of Organic Molecules. Spectroscopy. Spectroscopy Types :

E N D
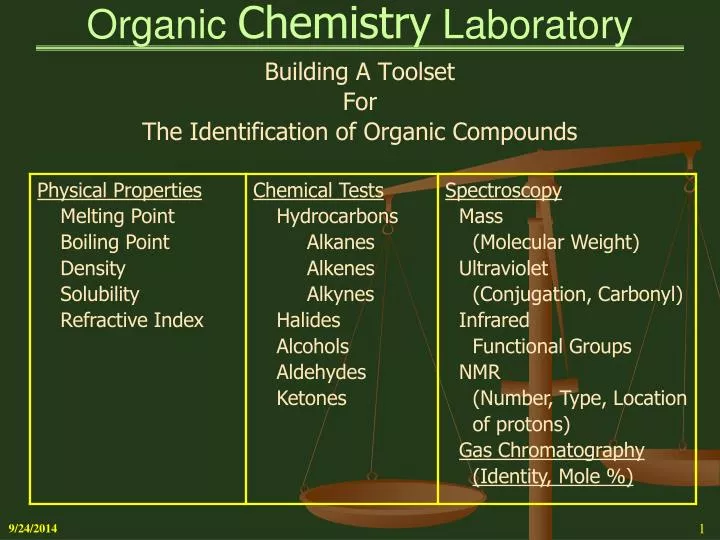
Organic Chemistry Laboratory Building A Toolset For The Identification of Organic Compounds
Spectroscopy The Absorption of Electromagnetic Radiation and the use of the Resulting Absorption Spectra to Study the Structure of Organic Molecules
Spectroscopy Spectroscopy Types: • Mass Spectrometry (MS) – Hi-Energy Electron-Beam Bombardment Use – Molecular Weight, Presence of Nitrogen, Halogens • Ultraviolet Spectroscopy (UV) – Electronic Energy States Use – Conjugated Molecules; Carbonyl Group, Nitro Group • Infrared Spectroscopy (IR) – Vibrational & Rotational Movements Use – Functional Groups; Compound Structure • Nuclear Magnetic Resonance (NMR) – Magnetic Propertiesof Nuclei Use – The number, type, and relative position of protons (Hydrogen nuclei) and Carbon-13 nuclei
The Electromagnetic Spectrum Frequency () High Low High Energy (E) Low Short Wavelength () Long Frequency 1.2 x 10¹⁴ Hz 3 x 10⁸ Hz 3 x 10¹⁹ Hz 3 x 10¹⁶ Hz 1.5 x 10¹⁵ Hz 2 x 10¹³ Hz 3 x 10¹¹ Hz 1 x 10⁹ Hz 6 x 10⁷ Hz 4 x103cm-1 1.25 x104cm-1 Wave Number 2.5 x104cm-1 0.002 cm-1 5 x104cm-1 1 x109cm-1 1 x107cm-1 667cm-1 10 cm-1 3 cm-1 0.01 cm-1 Cosmic & Ray Vacuum UV X-Ray Infrared Microwave Radio Frequency 1 mm 30 cm 1 m 5 m 0.01 nm 10 nm Wavelength 200 nm 2.5 15 400 nm 800 nm Near Ultraviolet Visible Nuclear Magnetic Resonance Vibrational Infrared Blue Red
NMR Nuclear Magnetic Resonance Spectroscopy NMR
NMR • Nuclear Magnetic Resonance Spectroscopy (NMR) • Nuclear Spin • Nuclear Spin State • Magnetic Moments • Quantized Absorption of Radio Waves • Resonance • Chemical Shift • Chemical Equivalence • Integrals (Signal Areas) • Chemical Shift - Electronegativity Effects • Chemical Shift - Anisotropy (non-uniform) effects of pi bonds • Spin-Spin Splitting
NMR • NMR • NMR is an instrumental technique to determine the number, type, and relative positions of certain Nuclei in a molecule • NMR is concerned with the magnetic properties of these nuclei • Many Nuclei types can be studied by NMR, but the two most common nuclei that we will focus on are Protons (1H1) and Carbon-13 (13C6) • The magnetic properties of NMR suitable nuclei include: • Nuclear Magnetic Moments • Spin Quantum Number (I) • Nuclear Spin States • Externally Applied Magnetic Field • Frequency of Angular Precession • Absorption of Radio Wave Radiation - Resonance
NMR • The Magnetic Properties • Many atomic nuclei have a property called “Spin” • Since all nuclei have a charge (from the protons in the nucleus), a spinning nuclei behaves as if it were a tiny magnet, generating its own Magnetic field • The Magnetic Field of such nuclei has the following properties – Magnetic Dipole, Magnetic Moment and Quantized Spin Angular Momentum • The Magnetic Moment (μ) of a nuclei is a function of its Charge and Spin and is defined as the product of the pole strength and the distance between the poles • Only Nuclei with Mass & Atomic number combinations of Odd/Odd, Odd/Even, Even/Odd possess “Spin Properties,” which are applicable to NMR • Note: Nuclei with a Mass & Atomic number combination of Even/Even do not have “Spin” and are not useful for NMR
NMR • Nuclear Spin States • Nuclei with spin (Magnetic Moment, Quantized Spin Angular Momentum, Magnetic Dipole) have a certain number of “Spin States.” • The number of “Spin States” a nuclei can have is determined by its “Spin Quantum Number I,” a physical constant, which is an intrinsic (inherent) property of a spinning charged particle. • The Spin Quantum Number (I) is a non-negative integer or half-integer (0, 1/2, 1, 3/2, 2, etc.). • The Spin Quantum Number value for a given nuclei is associated with the Mass Number and Atomic Number of the nuclei. • Odd Mass / Odd Atomic No - 1/2, 3/2, 5/2 Spin • Odd Mass / Even Atomic No - 1/2, 3/2, 5/2 Spin • Even Mass / Even Atomic No - Zero (0) Spin • Even Mass / Odd Atomic No - Integral (1, 2, 3) Spin
NMR • Nuclear Spin States (Con’t) • The number of allowed Spin States for a nuclei is: 2I + 1with integral differences ranging from +I to -I Ex. For I = 5/2 2I + 1 = 2 * 5/2 + 1 = 5 + 1 = 6 Thus, Spin State Values = 5/2, 3/2, 1/2, -1/2, -3/2, -5/2 • The Spin Quantum number (I) for either a Proton (1H1) or a Carbon-13 (13C6) nuclei is 1/2 • Thus, the number of Spin States allowed for either aProton (1H1) or a Carbon-13 (13C6) nuclei is: [2 * ½ + 1 = 1 + 1 = 2] • Therefore, the two spins states for either nuclei are: + 1/2 & - 1/2
NMR • Nuclear Spin States (Con’t) • In the absence of an applied Magnetic field, all the spin states ( + ½ & - ½ ) of a given nuclei are of equivalent energy (degenerate), equally populated, and the spin vectors are randomly oriented • When an external Magnetic Field is applied, the degenerate spin states are split into two opposing states of unequal energy • + 1/2 spin state of the nuclei is aligned with the applied magnetic field and is in a lower energy state • - 1/2 spine state of the nuclei is opposed to the applied magnetic field and is in a higher energy state • There is a slight majority of the lower energy (+1/2) nuclei
NMR • Two Allowed Spin States for a Proton Direction of an Externally Applied Magnetic Field (Ho) Ho Spin +1/2 Aligned Spin -1/2 Opposed - 1/2 Opposed to Field +1/2 Aligned E E + 1/2 Aligned with Field -1/2 Opposed Ho No Field Externally Applied Magnetic Field Ho Alignments Eabsorbed = (E-1/2 state - E+1/2 state) = h E = f(Ho) • The stronger the applied magnetic field (Ho), • the greater the energy difference between the spin states
NMR • Applied Magnetic Field, Frequency of Angular Precession • Under the influence of an externally applied magnetic field, Nuclei with “Spin Properties,” such as Protons & Carbon-13, begin to Precess about the axis of spin with Angular Frequency ω, similar to a toy top • The Frequency which a proton precesses is directly proportional to the strength of the applied magnetic field • For a proton in a magnetic field of 14,100 gauss (1.41 Tesla), the Frequency of Precession is approximately 60 MHz • That same proton, in a magnetic field of 23,500 gauss (2.35 Tesla), will have a Frequency of Precession of approximately 100 MHz • The stronger the applied magnetic field, the higher the Frequency of Precession and the greater energy difference between the +1/2 and -1/2 spin states
NMR • NMR Spectrometers • NMR spectrometers are rated according to the frequency, in MHz, at which a proton precesses - 60 MHz, 100 MHz, 300 MHz, 600 MHz, or even higher. • Continuous Wave (CW) NMR instruments are set up so that the externally applied magnetic field strength is held constant while a RF oscillator subjects the sample to the full range of Radio Wave frequencies at which protons (or C-13 nuclei) resonate. • In Fourier Transform (FT) NMR instruments, the RF oscillator frequency is held constant and the externally applied magnetic field strength is changed. • Most NMR instruments today are of the Continuous Wave type
NMR Typically, Continuous Wave (CV) Spectrometers are used in which the externally applied magnetic field is held constant and RF Radio Oscillator applies a full range of frequencies at which protons or C-13 nuclei resonate
NMR • Energy Absorption, Resonance • If long wave radio radiation (1-5 m) is applied from a RF Oscillator to a sample under the influence of a strong externally applied magnetic field, and the frequency of the oscillating electric field component of the incoming radiation matches the Angular Frequencyof Precession of the nuclei, the two fields couple and energy is transferred from the incoming radiation to the protons • This causes the nuclei with +1/2 spin state to absorb energy and change to the -1/2 spin state • When Energy is absorbed at specific frequencies it is referred to as being “Quantized” • When a proton absorbs a radio wave, whose frequency matches its Angular Frequency of Precession, it is said to be in “Resonance” with the incoming signal
NMR • Electron Density, Frequency of Angular Precession • Protons exist in a variety of chemical and magnetic environments, each represented by a unique electron density configuration • Under the influence of a strong externally applied magnetic field, the electrons around the proton are induced to circulate, generating a secondary magnetic field (local diamagnetic current), which acts in opposition(diamagnetically) to the applied magnetic field • This secondary field shields the proton (diamagnetic shielding or diamagnetic anisotropy) from the influence of the applied magnetic field • Recall from slide # 13 that the Angular Frequency of Precession is directly proportional to the applied Magnetic Field strength
NMR • Electron Density, Frequency of Angular Precession (Con’t) • As the shielding of the proton increases(increased electron density) it diminishes the net applied magnetic field strength reaching the proton; thus the Angular Frequency of Precession is lower • If the electron density decreases, more of the applied magnetic field strength impacts the proton and it will precess at a higher Angular Frequency • Thus, each proton with a unique electron density configuration will “Resonate” at a unique “Frequency of Angular Precession • In a 60 MHz NMR Spectrometer all protons will resonate at a magnetic field strength of approximately 60 MHz, but each unique proton will resonate at its own unique frequency, with differences among unique protons of only tens of Hertz in a field of 60 MHz
NMR • NMR Spectra – Fourier Transform vs. Continuous Wave • Fourier Transform • In a Fourier Transform (FT) NMR, the spectrum produced is a plot of the magnetic field strength – representing the frequency of the resonance signal – on the X-axis – versus the intensity of the absorption on the Y-Axis. • Each signal – consisting of one or more peaks – represents the “Resonance Frequency” of a particular type of proton with a unique chemical & magnetic (electron density) environment.
NMR • NMR Spectra – Fourier Transform vs. Continuous Wave • Fourier Transform (Con’t) • As the pen of the recorder moves from left to right, the value recorded on X-axis of the NMR spectrum represents small increments of increasing magnetic field strength. • The right side of the NMR Spectrum is referred to as being “Upfield” (higher magnetic field strength). • The left side of the NMR Spectrum is referred to as being “Downfield” (lower magnetic field strength).
NMR • NMR Spectra – Fourier Transform vs. Continuous Wave (Con’t) • Continuous Wave • In a Continuous Wave NMR, the spectrum produced is a plot of the RF Radio Oscillator Frequency versus the intensity of the absorption on the Y-Axis. • As before, each signal – consisting of one or more peaks – represents the “Resonance Frequency” of a particular type of proton with a unique chemical & magnetic (electron density) environment. • As the pen of the recorder moves from left to right, the value recorded on X-axis of the NMR spectrum represents a decreasing RF Oscillator Frequency (Resonance Frequency)
NMR • NMR Spectra – Fourier Transform vs. Continuous Wave (Con’t) • Continuous Wave (Con’t) • The Signals on the right side of the NMR Spectrum represent protons (C-13 nuclei) that Resonate at lower frequencies. • The Signals on the left side of the NMR Spectrum represent protons (C-13 nuclei) that Resonate at higher frequencies.
NMR • NMR Spectra – FT or CW: the spectrum looks the same • A FT or CW spectrometer will produce the same spectrum. • The peaks on the right side of the spectrum represent those protons (or C-13 nuclei) that resonate at the highest externally applied magnetic field strength and the lowest frequency • This statement would appear to be in conflict with the statement on Slide #13: “The Frequency which a proton Precesses is directlyproportional to the strength of the applied magnetic field” • This apparent conflict is resolved by consideration of the influence of the secondary magnetic field set up by the Diamagnetic Current from circulating valence electrons. • This magnetic field opposes the externally applied field reducing the effect of the applied Magnetic Field on the proton, which in turn lowers the Resonance Frequency
NMR • NMR Spectra – FT or CW: the spectrum looks the same (Con’t) • The protons that resonate and produce signals on the right side of the NMR Spectrum (up field) have higher electron density shields than protons that resonate downfield • The net effect of the difference between the externally applied magnetic field and the amount prevented from actually reaching the proton results in a significantly reduced Resonance Frequency • As the NMR spectrum moves from right to left, the electron density about the various proton environments is decreasing, resulting in more of the externally applied magnetic field getting through to the proton • As this net magnetic force is increasing downfield toward the left side of the spectrum, the Resonance Frequency increases in conformance with the statement on Slide #13
NMR • NMR Spectra – Background Summary Signal • In a continuous Wave NMR, the strength of the externally applied magnetic field is held “constant”. • Protons that produce signals on the right side of the NMR spectrum have a higher amount of valence electron shielding. • The Magnetic Field produced by circulating valence electrons (Diamagnetic Current) opposes the externally applied Magnetic Field. • The Diamagnetic Field diminishes the amount of Applied Magnetic Field reaching the proton. • The net amount of magnetic force impacting the proton is reduced resulting in a lower Resonance Frequency. • As the Electron Density about a proton decreases downfield, the Resonance Frequency increases because more of the applied Magnetic Field impacts the Proton. Absorption TMS 13 PPM 0 Applied Magnetic Field Strength – Ho is held constant Applied Radio Frequency - RF Shielding of Proton by Valence Electrons Diamagnetic (Anisotropic) Magnetic Field Strength Produced by Circulation of Valence Electrons Net Magnetic Field Impacting Proton Frequency of Angular Precession(Resonance Frequency)
NMR • NMR Spectra – The Chemical Shift • The differences in the applied Magnetic Field strength (Angular Frequency of Precession) at which the various proton configurations in a molecule Resonate are extremely small • The differences amount to only a few Hz (parts per million) in a magnetic field strength of 60, 100, 300, .... MHz (megahertz) • It is difficult to make direct precise measurements of resonance signals in the parts per million range
NMR • NMR Spectra – The Chemical Shift • The typical technique is to measure the difference between the Resonance signals of various sample nuclei and the Resonance signal of a standard reference sample (see slides 25 & 26) • A parameter, called the “Chemical Shift” (), is computed from the observed frequency shift difference (in Hz) of the sample and the “standard resonance signal” divided by the applied Magnetic Field rating of the NMR Spectrometer (in MHz) • Thus, the Chemical Shift () is field-independent of the Magnetic Field rating of the instrument
NMR • NMR Spectra – The Chemical Shift (Con’t) • The Chemical Shift is reported in units of: “Parts Per Million” (ppm) • Ex: If a proton resonance was shifted downfield 100 Hz relative to the standard in a 60 MHz machine, the chemical shift would be: • = 100 Hz / 60 MHz = 1.7 ppm • By convention, the Proton Chemical Shift values increase from right to left, with a range of 0 – 13 • In other words: Chemical Shift values decrease with increasing Magnetic field strength or Chemical Shift values increase with increasing Resonance frequency!
NMR • NMR Spectra – The Internal Reference Standard • The universally accepted standard used in NMR is: Tetramethylsilane (TMS) • The 12 protons on the four carbon atoms have the same chemical and magnetic environment and they resonate at the same field strength, i.e., one signal (1 peak) is produced • The protons are highly protected from the applied magnetic field because of high valence electron density • The strength of the Diamagnetic Field generated by the valence electrons in TMS is greater than most other organic compounds
NMR • NMR Spectra – The Internal Reference Standard • Thus, little of the applied magnetic field gets through to the TMS protons reducing the Frequency of Angular Precession (Resonance Frequency) to a value that is lower than most other organic compounds. • For most all other Proton environments, the electron density is less than TMS and slightly more of the applied magnetic field gets through to the protons resulting in a slightly higher frequencies of Angular Precession.
NMR • NMR Spectra – The Internal Reference Standard • The TMS signal appears on the far right hand side of the X-axis. • Small amount TMS in the sample produces large signal • By definition, the Chemical Shift value for TMS is “0 ppm” • Thus, most all other protons will have Chemical Shifts > 0 and will be downfield from the TMS signal.
NMR • NMR Spectra – Simple Example All six protons of Ethane are chemically and magnetically equivalent and all resonate at the same frequency producing one signal consisting of “one” peak, i.e., a singlet. An NMR Signal can consist of one or more “peaks” Multiple peaks are produced by a phenomenon called “spin-spin splitting” Note – See slides 53-62 for a discussion of Spin/Spin Splitting For the chemically equivalent protons in Ethane there is no splitting, thus the signal consists of “one” peak, a singlet See next slide for more NMR Spectrum examples, showing basic splitting patterns (6) Signal(singlet) Absorption Ethane TMS 13 12 11 10 9 8 7 6 5 4 3 2 1 0 Chemical Shift (PPM) Typical location (1 ppm) of resonance signal for Methyl group protons not under the influence of an electronegative group (see slide ) Note the “6” at the top of the signal This is the peak integration value and represents the electronically integrated area under the signal curve and is proportional to the number of Protons generating the signal, i.e., Ethane has 6 chemically and magnetically equivalent protons See slides 36-39 for a discussion of signal integration
NMR • NMR – Simple Examples The Six (6) equivalent Methyl Protons arerepresented as a Triplet at about 1 ppm. The 3 Triplet peaks are produced by Spin-Spin splitting based on the 2 protons attached to the Methylene Group (n + 1 rule). (2) (6) Propane The Two (2) equivalent Methylene Protonsare represented as a Septet at about 2 ppm. The 7 Septet peaks are produced by spin-spin splitting based on the 6 protons attached to the two Methyl groups (6 +1 = 7). TMS 13 12 11 10 9 8 7 6 5 4 3 2 1 0 Chemical Shift (PPM) (3) (5) The Methyl group donateselectrons to Benzene ringactivating it. The Methylprotons have less electrondensity (deshielded), thus,the Chemical Shift is moveddownfield. 3 equivalent Protons onMethyl Group Carbon attached to a Benzene ring Carbon that has no attached protons. Therefore, the signal is a singlet with no splitting. 5 unsubstituted Protonson Benzene ring are notequivalent, producing complex spitting patterns typical of the resonance structures in aromatic rings.See slides 60-65. Toluene 13 12 11 10 9 8 7 6 5 4 3 2 1 0
NMR CH3 C O CH3 O O C CH3 CH3 CH3 O CH2Cl • Chemical Equivalence • Protons in a molecule that are in chemically identical environments will often show the same chemical shift • Protons with the same chemical shift are chemically equivalent • Chemical equivalence can be evaluated through symmetry • Protons in different chemical environments have different chemical shifts, i.e. a signal is produced for each. Chemicals giving rise to 1 NMR signal Chemicals giving rise to 2 NMR signals H CH3 H H H H H H H H H CH3 Benzene Cyclopentane Methyl Acetate 1,4 dimethyl benzene (p-xylene) Acetone 1-Chloro Methyl Ether
NMR • An Isomer Example – C5H12O a 9 Signals Rel Area Value of Signal a ~ 1 9 b > 2 2 c ~ 2 1 (a) CH3 (b) (c) (a) b 2 CH3 C CH2OH c 1 tms CH3 (a) 2-Dimethyl Propanol 3 2 0.9 0 9 protons on 3 Methyl groups are equivalent and are not under the influence of the electronegative OH group. 2 protons on Methylene group are equivalent and are influenced by electronegative OH group. The proton on OH group is concentration and hydrogen bonding dependent. Location on spectrum variable. Note: All signals are “singlets”, i.e., no adjacent protons to produce spin-spine splitting. a 9 Signals Rel Area Value of Signal a ~1 9 b >>1 3 (a) CH3 b 3 (b) (a) CH3 C O CH3 tms CH3 (a) t-Butyl Methyl Ether 3 2 1 0 9 protons on 3 Methyl groups are equivalent and not under the influence of electronegative group. 3 protons on single Methyl groups are equivalent and are under influence of electronegative oxygen.
NMR • Integrals (Signal Area) • An NMR spectrum also provides means of determining How Many of each type of proton the molecule contains. • The Area under each signal is proportional to the number of protons generating that signal. • In the Phenylacetone example below there are three (3) chemically distinct types of protons: Aryl (7.2 ppm), Benzyl (3.6 ppm), Methyl (2.1 ppm) • The three signals in the NMR spectrum would have Relative Areas in the ratio of 5:2:3. • Thus, 5 Aryl protons, 2 Benzyl protons, and 3 Methyl protons Phenylacetone 7.2 ppm (5 protons) 2.1 ppm (3 protons) 3.6 ppm (2 protons)
NMR • NMR Spectrum – Phenylacetone (103-79-7) Ring 5 Protons Methyl 3 Protons Methylene 2 Protons C9H10O
NMR • Integrals (Signal Area) (Con’t) • NMR Spectrometer electronically integrates the area under a signal and then traces rising vertical lines over each peak by an amount proportional to the area under the signal – see next slide. • The heights of vertical lines give RELATIVE numbers of each type of hydrogen. • Integrals do not always correspond to the exact number of protons,e.g., integrals of 2:1 might be 2H:1H or 4H:2H or... • Computation • Draw Horizontal lines separating the adjacent signals. • Measure vertical distance between the Horizontal lines. • Divide each value by the smallest value. • Multiple each value by an integer >1 to obtain whole numbers. • See example computation on next Slide.
NMR 32.5 div 22.0 div = 1.48 • Integrals (Signal Area) (Con’t) • NMR Spectrum – Benzylacetate (C9H10O2) Peak 7.3 ppm (c) - (h1) 55.5 Div Peak 5.1 ppm (b) - (h2) 22.0 Div Peak 2.0 ppm (a) - (h3) 32.5 Div (b) (c) (a) h3 55.5 div 22.0 div = 2.52 h2 22.0 div 22.0 div = 1.00 h1 2.52 : 1.00 : 1.48 5 : 2 : 3 c : b : a Each value multiplied by “2” to obtain integral values
NMR • Chemical Shift – Impact of Electronic Density • Valence Electrons • In the presence of the applied magnetic field, the valence electrons in the vicinity of the proton are induced to circulate (Local Diamagnetic Current) producing a small secondary magnetic field • The greater the electron density circulating about the nuclei, the greater the induced magnetic shielding effect • The induced magnetic field acts in opposition (diamagnetically opposed) to the applied magnetic field, thus shielding the proton from the effects of the applied field in a phenomenon called Local Diamagnetic Shielding or Diamagnetic Anisotropy • As the Diamagnetic Anisotropy increases, the amount of the applied magnetic field reaching the proton is diminished, decreasing the frequency of Resonance
NMR • Chemical Shift - Anisotropy (non-uniformity) • For some proton types, the chemical shifts can be complicated by the type of bond present • Aryl compounds (benzene rings), Alkenes (C=), Alkynes (C ), and Aldehydes (O=CH) show anomalous resonance effects caused by the presence of electrons in these structures • The movement of these electrons about the proton generate secondary non-uniform (anisotropic) magnetic fields • The relative shielding and deshielding of protons in groups with electrons is dependent on the orientation of the molecule with respect to the applied magnetic field
NMR • Chemical Shift - Anisotropy (non-uniformity) (Con’t) • The Diamagnetic Anisotropic effect diminishes with distance • In most cases, the effect of the Diamagnetic Anisotropic effect is to Deshield the protons, increasing the Chemical Shift • In some cases, such as acetylene hydrogens, the effect of the anisotropic field is to shield the hydrogens, decreasing the Chemical Shift • In a Benzene ring , the electrons are induced to circulate around the ring by the applied magnetic field, creating a ring current, which in turn produces a magnetic field further influencing the shielding of the ring protons
NMR • Chemical Shift - Anisotropy (non-uniformity) (Con’t) • The presence of ring currentcauses the applied magnetic field to become non-uniform (diamagnetic anisotropy) in the vicinity of the benzene ring • The effect of the anisotropic field is to further deshieldthe benzene protons, increasing the chemical shift • Thus, protons attached to the benzene ring are influenced by three (3) magnetic fields: • Strong Applied Magnetic Field • Local Diamagnetic Shielding by Valence Electrons • Anisotropic Effect from the Ring Current • The net effect of the deshielding of the Benzene Ring protons is to increase the Chemical Shift far downfield to about 7.0 ppm
NMR • Electron Density and Electronegativity • Protons in a molecule exist in many different electronic environments (Methyl group (CH3), Methylene group (CH2), bonds, unsubstituted Benzene ring Protons, Amino protons (NH), Hydroxyl protons (OH), etc.) • Each proton with a unique electron density configuration will have a unique Angular Frequency of Precession • The electron density of a given proton and thus, the frequency of precession, can be further influenced by the presence of electronegative groups in the vicinity of the proton • Electronegative groups (or elements) are electron withdrawing, pulling electron density away from the proton
NMR • Chemical Shift – Impact of Electronegative Elements • The decrease in electron density about the proton results in a lower secondary magnetic field, a diminished shielding effect, an increase in the strength of the applied magnetic field reaching the nuclei, resulting in an increase in the precession frequency • Electronegative elements are electron withdrawing • When added to a carbon atom with protons attached, the Electronegative element withdraws electron density about the proton • Reducing electron density deshields the proton from the effect of the applied field, allowing more of the magnetic field to impact the proton
NMR Chemical Shift – Impact of Electronegative Elements (Con’t) • Recall that Deshielding the proton increases the Resonance Frequency producing a greater chemical shift, i.e., the resonance peak is moved downfield to the left on the spectrum • The chemical shift increases as the electronegativity of the attached element increases • Multiple substitutions have a stronger effect than a single substitution • Electronegativity also affects the Chemical Shift of Protons further down the chain. But the effect is diminished as distance from the Electronegative Element increases
NMR 1.53 ppm 3.59 ppm • Chemical Shift – Impact of Electronegative Elements Compound CH3X CH3F CH3OH CH3Cl CH3Br CH3I CH4 (CH3)4Si Element X F O Cl Br I H SiElectronegativity of X 4.0 3.5 3.1 2.8 2.5 2.1 1.8 Chemical Shift (ppm) 4.26 3.40 3.05 2.68 2.16 0.23 0 CH4 CH3OH CH3CH2OH CH3CH2CH2OH 0.23 ppm 3.39 ppm 1.18 ppm 0.93 ppm 3.49 ppm Note: The Chemical Shift of the Proton increases as the distance from the Electronegative Oxygen increases.
NMR C CH3 CH2 Chemical Shift values of typical Proton environments and the effects of Electronegative Elements on the Chemical Shift. -OH, -NH TMS 12 11 10 9 8 7 6 5 4 3 2 1 0 (ppm) CH2F CH2Cl CH2Br CH2I CH2O CH2NO3 Methine (1H) CH2Ar CH2NR2 CH2S C C H CH2 C C CH C C H C CH2 C Methylene (2H) CHCl3 Methyl (3H) O Groups with variable chemical shifts (Protons attached to elements other than Carbon) Effects of Electronegativity Acids RCOOH 11.0 - 12.0 ppm Aldehydes RCOH 9.0 - 10.0 Phenols ArOH 4.0 - 7.0 Alcohols ROH 0.5 - 5.0 Amines RNH2 0.5 - 5.0 Amides RCONH2 5.0 - 8.0 Enols CH=CH-OH 15.0 F > O > Cl = N > Br > S > I Electronegative Elements will pull electron density away from the proton diminishing the electron density. Proton is exposed to increased effects of the applied magnetic field, which increases the frequency of absorbance (Chemical Shift) moving the Resonance Signal downfield to the left.
NMR Aliphatic Alicyclic (CH2, CH3) -Substituted Aliphatic Alkyne -Monosubstituted Aliphatic -Disubstituted Aliphatic Alkene Aromatic & Heteroaromatic Aldehydic Carboxylic • General Regions of Chemical Shifts TMS 12 11 10 9 8 7 6 5 4 3 2 1 0 (ppm)
NMR Approximate Chemical Shifts Protons (1H1) Carbon (13C6) Type of Carbon AtomChemical Shift , (ppm) Type of ProtonChemical Shift, (ppm) 1o Alkyl, RCH3 0.8 - 1.0 2o Alkyl, RCH2R 1.2 - 1.4 3o Alkyl, R3CH 1.4 - 1.7 Allylic, R2C C CH3 1.6 - 1.9 R Ketone, RCCH3 2.1 - 2.6 O Benzylic, ArCH2-R 2.2 - 2.5 Acetylenic, RC CH 2.5 - 3.1 Alkyl Iodide, RCH2I 3.1 - 3.3 Ether, ROCH2R 3.3 - 3.9 Alcohol, HOCH2R 3.3 - 4.0 Alkyl Bromide, RCH2Br 3.4 - 3.6 Alkyl Chloride, RCH2Cl 3.6 - 3.8 Vinylic, RC2 CH2 4.6 - 5.0 Vinylic, RC2 CH2-R 5.2 - 5.7 Aromatic, ArH 6.0 - 9.5 Aldehyde, RCH 9.0 - 10.0 O Alcohol hydroxyl, ROH 0.5 - 6.0a Amino, R NH2 1.0 - 5.0a Phenolic, ArOH 4.5 - 7.7a Carboxylic, RCOOH 11 - 12a 1o Alkyl, RCH3 0 - 40 2o Alkyl, RCH2R 10 - 50 3o Alkyl, RCHR2 15 - 50 Alkyl Halide or Amine, C-X 10 - 65 Alcohol or Ether, C-O 50 - 90 Alkyne, C 60 - 90 Alkene, C = 100 - 170 Aryl, Ar- 100 - 170 Nitriles, -C N - 120 - 130 O Amides, -C - N - 150 - 180 O Carboxylic Acids, Esters, C O 160 - 185 O Aldehydes, Ketones, -C - 182 - 215 C- a Chemical shifts of these protons vary in different solvents and with temperature