Download

1 / 126
1.76k likes | 2.86k Views
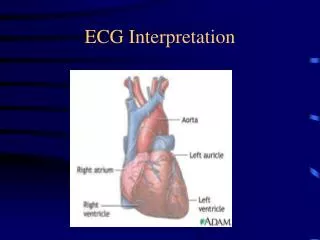
CHAMBERS ENLARGEMENT ECG-Interpretation. BY RAGAB ABDELSALAM(MD) Prof. of Cardiology. * Work overload : may be described as > Enlargement, > Dilation, or > Hypertrophy. * The term enlargement generally encompasses both dilation and hypertrophy.

E N D
CHAMBERS ENLARGEMENTECG-Interpretation BY RAGAB ABDELSALAM(MD) Prof. of Cardiology
* Work overload : may be described as > Enlargement, > Dilation, or > Hypertrophy. * The term enlargement generally encompasses both dilation and hypertrophy. * Diastolic overload : Increased diastolic volume, referred to as volume overload .
** Chamber dilation as in : valvular regurgitation and CHF & DCM **Cardiac hypertrophy= increase in muscle mass of the myocardium= pressure overload or systolic overload. **Hypertrophy usually as in: > valvular stenosis or hypertension.
** Hypertrophy and dilation frequently occur together, as both are ways in which the heart compensates to maximize cardiac output ** The atria, which are chambers with relatively thin walls, tend to respond to both volume overload and pressure overload by dilating. ** The term enlargement is more inclusive of both dilation and hypertrophy
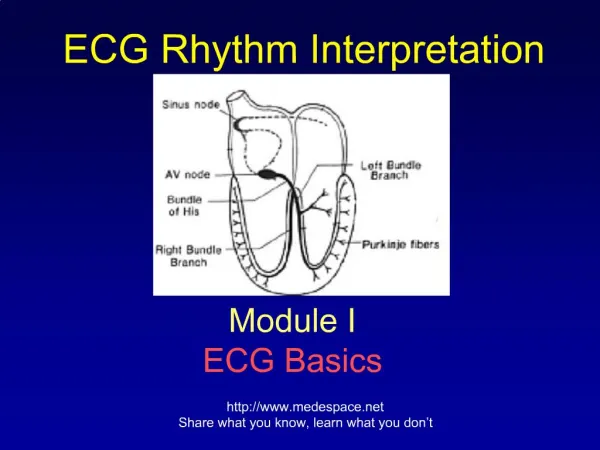
GENERAL ECG CONSIDERATIONS * When one evaluates the ECG for evidence of chamber enlargement, >>Three basic concepts are helpful in understanding why certain ECG changes occur
1. The chamber may take longer to depolarize, potentially causing an ECG waveform of prolonged duration. 2. The enlarged chamber may generate more current than normal, thereby producing greater voltage and an ECGwaveform of increased amplitude. 3. A larger percentage of the total electrical current may move through the expanded chamber, thus shifting the electricalaxis of the ECG
* Strain. * In patients with LV enlargement, the myocardium may become so enlarged that portions may not receive adequate blood flow. * Because CBF perfuses from epicardium to the endocardium, the myocardium that is most vulnerable to ischemia in patients with LV enlargement is the subendocardium.
Subendocardial ischemia causes changes in the ST segment and T wave. • These changes in the ST segment and the T wave are referred to as the strain pattern. • The ECG changes include depression of the ST segment and inversion of the T wave and are considered to be secondary changes
The strain patternis most evident in those leads that overlie the enlarged ventricle and will show tall R waves. • Therefore, RV strain will be evident in leads V1 and V2, whereas left ventricular strain will be seen in leads I, aVL, V5, and V6.
> The significance of strain is that it usually indicates severe hypertrophy and may even signify the onset of ventricular dilation > When true myocardial ischemia occurs in the presence of LV enlargement, primary changes in the T wave appear as deep, symmetric T wave inversion and will replace the secondary changes in the T wave.
Electrical axis • The sum of all electrical currents in the heart during systole * Electrical axis can be evaluated for the P, QRS, and T waves. * However, most references refer to the mean QRS axis in the frontal plane,* Specific axis determination requires inspection of the six limb leads
Electrical axis is recorded in degrees progressing in a clockwise direction with the positive electrode of lead I, or straight to the patient's left, designated as 0°. • The negative electrode of lead I, or straight to the patient's right, is +180°
* The normal mean QRS axis is directed leftward somewhere between 30° and +90°. * Some sources expand normal axis to include +120° *Abnormal axis deviations can be seen in conditions such as hemiblocks and chamber enlargement.
* Axis deviations: Normal axis: 0° to +90° Left axis: 30° to 90° Right axis: >+90° to ±180° Extreme axis: 90° to ±180°
>> P wave represents atrial depolarization, >> P wave is assessed for evidence of atrial enlargement. >> Similarly, QRS complex is assessed to determine ventricular enlargement.
>> When the ventricle is enlarged,its corresponding atrium is often enlarged. >> The presence of atrial enlargement should therefore trigger the search for evidence of ventricular enlargement
THENORMAL P WAVE > It represents the sum of the depolarizations of the R & L atria. > Because the SAN is located in the RA , RA depolarization begins slightly before LA depolarization.
> Therefore, the initial portion of the P wave primarily reflects RA depolarization, and the terminal portion of the P wave reflects LA depolarization.P wave usually has a smooth or blunted apex.
The normal time interval for complete atrial depolarization (duration of the P wave) is less than 0.12 seconds. • Whether the P wave is +ve or –ve &, it should not exceed 2.5 mm in amplitude. • P waves are best seen in II & V1.
A vector is a force such as electric current that has both direction and magnitude. • Mean P wave vector reflects the average electrical forces that flow through the atria. This mean P wave vector travels parallel to lead II toward the +veelectrode of that lead.
P wave morphology in lead V1 is often biphasic. • The P wave in V1 normally has an initial positive deflection that reflects RA depolarization and is usually less than 1.5 mm in amplitude.
The terminal portion of the P wave in lead V1 has a negative deflection that reflects LA depolarization and normally does not exceed 1 mm in depth .**P wave usually has the largest upright deflection in lead II.
* Changes in P wave morphology may result from : > chamber enlargement, > rhythm disturbances > abnormalities in atrial conduction. *** Therefore, it has been suggestedthat the term atrial abnormality be used..
A ) Left Atrial EnlargementThe ECG patterns for LA enlargement may evolve from conditions such as > LA hypertension, > LA hypertrophy, > or impaired interatrial conduction.
** P-mitrale is a term used to describe a wide and abnormally notched P wave commonly seen in patients who have mitral stenosis and possible LA enlargement.
>>a broad, notched P wave in leads I & II, >>slurring of the terminal portion of the P wave.
>> The distance between the two peaks of the notched P wave is usually longer than 0.04 s. >> P duration is > 0.12 s. >> The amplitude is slightly increased.
The term P terminal force: A measurement of the negative-terminal component of the P wave in lead V1 and is used to help detect enlargement of the left atrium.
It is calculated by multiplying the depth (in millimeters) of the terminal P wave deflection by its duration (in seconds). The value is stated inmillimeters per second. A P terminal force greater than 0.03 mm/sec is a sign of left atrial enlargement.
* A false positive diagnosis of LA enlargement frequently occurs in patients with (COPD) with or without cor pulmonale
In these patients, a prominent negative P wave can be seen in the right precordial leads without the presence of left-sided heart disease. >>This may be due to the anatomic changes that occur in the diaphragm of patients with COPD.
Right Atrial EnlargementThe classic causes of RA enlargement are > COPD > Congenital heart disease.( PS Ebstien,s Anomally …) > Pulm. Embolism.
Mechanism of P- pulmonale in COLP : > Increased sympathetic stimulation . > Hyperinflation of the lungs, which often results in a lowering of the diaphragm and subsequent downward displacement of the heart. This causes the heart to have a more vertical or rightward orientation and clockwise rotation in the chest.
* RA enlargement : A) P-pulmonale ; ( P in III > P in II ) as in COLD . B) P-congenitale: P- in II > P in III ) as in congenital HD >>> PS ,… C) P-tricuspidale : ( P- wave is tall & notched, with the first peak taller than the second. As in TVD. D) P-Ebstein: the tallest P-wave you can see ( usually > ORS in II )
Summary of ECG criteria for RA enlargement > Normal P wave duration > Tall, peaked P waves with an amplitude greater than 2.5 mm in leads II, III, aVF > Positive deflection of the P wave in lead V1 or V2 is greater than 1.5 mm > P wave axis in the frontal plane leads is +75° or greater
Clinical Mimics. • The P-pulmonale pattern can appear transiently with : > Acute pulmonary embolism, > Acute bronchial asthma, > Arterial desaturation. > Coronary artery disease, angina pectoris, tachycardia, and exercise.
Increased sympathetic tone can increase the amplitude of the P wave. • Moreover, the ECG of healthy persons who have a tall, slim build may reveal tall, peaked P waves related to the more vertical position of the heart
A pseudo P-pulmonale pattern may be seen in patients with LA enlargement due to MV disease • In a pseudo P-pulmonale pattern, as seen in LA enlargement, analyzing lead V1 for the presence of a negative P terminal force may help in the differential diagnosis of true vs pseudo P-pulmonale.
Biatrial Enlargement Abnormalities ofthe two atria affect different components of the P wave, with the ECG pattern manifesting characteristics of both left and right atrial enlargement
Summary of ECG criteria for biatrial abnormality * Large biphasic P wave in V1 with initial positive portion of the P wave greater than 1.5 mm * terminal negative component up to 1 mm in depth and 0.04 seconds in duration (abnormal P terminal force)
* Tall, peaked P wave> 1.5 mm in the right precordial leads (V1, V2) and a wide, notched P wave in the limb leads (I, II, III, aVR, aVL, aVF) or left precordial leads (V5 and V6) * Increase in both amplitude (2.5 mm or more) and duration (0.12seconds or more) of the P wave in the limb leads
OVERVIEW OF VENTRICULAR PHYSIOLOGY> The ventricles consist of the interventricular septum and the free walls of the right and left ventricles. > The free wall of the LV is at least three times thicker than that of the RV, and the IVS forms a continuum with the free wall of the LV
TheNormal QRS ComplexThe QRS complex reflects ventricular depolarization and is inscribed on the ECG after ventricular activation. • The initial vector is depolarization of the IVS, which occurs from left to right. This is followed by depolarization of the ventricles. • The impulse is delivered to the subendocardium of both ventricles at about the same time, resulting in an almost simultaneous depolarization.