Download
1 / 15
150 likes | 281 Views
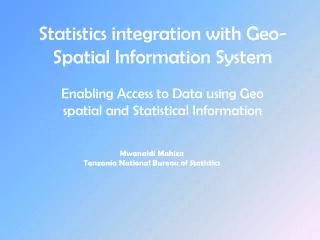
Geo-statistics and Scales. Mathieu Vliegen. Outline. Referencing statistical output and scales in small area statistics Comparison of scales: differentiation analysis Results of analysis for the 3 biggest cities in the Netherlands What does the analysis tell us?. Referencing and scales.

E N D
Geo-statistics and Scales Mathieu Vliegen EFGS Workshop, The Hague, Netherlands
Outline • Referencing statistical output and scales in small area statistics • Comparison of scales: differentiation analysis • Results of analysis for the 3 biggest cities in the Netherlands • What does the analysis tell us? EFGS Workshop, The Hague, Netherlands
Referencing and scales Referencing Scales Postal areas Sub-city areas Grid squares • Regional • Spatial • Geometrical EFGS Workshop, The Hague, Netherlands
Differentiation analysis • Range analysis: difference between highest and lowest scale value • Homogeneity analysis: variation coefficient = standardized standard deviation of the scale value distribution (standard deviation / value of the relevant territorial unit ) EFGS Workshop, The Hague, Netherlands
Scales used in the analysis • Postal areas • Sub-city areas • Grid squares • 4-digit (e.gr. 2203) • 5-digit (e.gr. 2203H) • Districts • Neighbourhoods • 500 x 500 m • 100 x 100 m EFGS Workshop, The Hague, Netherlands
Variables analysed • Population aged 65 and over (%) • Population with non-western foreign background (%) • One-person household (%) • Private housing (% dwellings) • Average ratable value dwellings EFGS Workshop, The Hague, Netherlands
Key figures: Population EFGS Workshop, The Hague, Netherlands
Key figures: Households EFGS Workshop, The Hague, Netherlands
Key figures: Housing EFGS Workshop, The Hague, Netherlands
Number of small areal units EFGS Workshop, The Hague, Netherlands
Small areal units: average population EFGS Workshop, The Hague, Netherlands
Amsterdam: Variation coefficients EFGS Workshop, The Hague, Netherlands
Rotterdam: Variation coefficients EFGS Workshop, The Hague, Netherlands
The Hague: Variation coefficients EFGS Workshop, The Hague, Netherlands
What does the analysis tell us? • Awareness of the implications of the areal scale with respect to the statistics produced at that scale (how to lie with statistics?) • Definition as detailed as possible of the area scale used in order to protect users for possible pitfalls using the statistics in question EFGS Workshop, The Hague, Netherlands