Download
1 / 31
320 likes | 547 Views
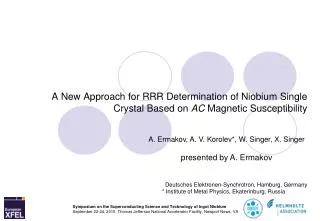
AC-susceptibility method for Curie temperature determination. Experiment and theory. A.V. Korolev , M.I. Kurkin, Ye.V. Rosenfeld Institute of Metal Physics, Ural Branch of Russian Academy of Sciences. INTODUCTION. There are a lot of different methods for determination of Curie temperature T C

E N D
AC-susceptibility method for Curie temperature determination. Experiment and theory A.V. Korolev, M.I. Kurkin, Ye.V. RosenfeldInstitute of Metal Physics, Ural Branch of Russian Academy of Sciences
INTODUCTION There are a lot of different methods for determination of Curie temperature TC I would like to recall you only one of them. Belov-Goriaga (Belov-Arrott) method. This method is very famous and very popular in literature. The method is based on the second-order phase transitions Landau theory for ferromagnetic materials.
INTODUCTION L. D. Landau and E. M. Lifshitz, Statistical Physics, 2nded. Nauka, Moscow, 1964; Pergamon, Oxford, 1980 Landau expansion of the thermodynamic potential Fin terms of Mis usually used for processing the results of magnetic measurements F = F0 – MH + (1/2)A(T – TC)M2 + (1/4)BM4 TC,A, B = const; after minimization: H/M= A(T – TC) + BM2 ; T=const: H/M= a + BM2
INTODUCTION Experimental H/M vs. M2 dependencies without demagnetization correction for the Gd sample in the shape of flat parallelepiped in the vicinity of the assumed TC of Gd. V.I. Zverevetal., JMMM (2011), doi:10.1016/j.jmmm.2011.05.012 300 K 280 K
INTODUCTION A.V.Korolev et al., PHYS. SOLID STATE, 52, 561-567, 2010
MOTIVATION I can show you more and more the same kind of typical graphs. And every time we find a row non-linear curves near Tcat low temperature. But the step by step increasing temperature changing occurs and non-linear curves become more and more linear. This is most clearly illustrated in this slide. The temperature range is from 226 to 234 K. We see that the experimental points at 234 and 233 K, practically lie on a straight line. A.V.Korolev et al., Phys. Met. Metallogr. 98, S1, s86-s93, 2004 LINIAR 234 K La0.85Sr0.15MnO3 single crystal 226 K NONLINIAR M2 (emu/g)2
MOTIVATION The displayed data suggest that the Landau theory "does not work" near T = Tc ± (0.01-0.02) Tc. Method of determining the Tc from such data, in my opinion, is not justified. At the same time, we can assume that this theory should well describe experiment near Tc, but at T > Tc +(~0.02)Tc. The above data have motivated us to study the temperature dependence of the differential susceptibility. It has long been known (K.P. Belov, Magnetic Transitions (Fizmatgiz, Moscow, 1959; Consultants Bureau, New York, 1961) that temperature dependence of differential susceptibility =M/H has the maximum at T = Tm, which moves from Tc to high temperature region with increasing field.
Modern magnetometers with DC and AC options: MPMS, PPMS (Quantum Design, USA) DC-option H(t)=const ≤ 50 kOe In our AC experiment: f < 100 Hz, ha< 4 Oe 1. Only the 1-st harmonic (no higher-order harmonics) 2. ’ >> ’’ THEREFORE ’ = M/H AC-option h(t) = hasin(t) sample
EXPERIMENT A.V.Korolev et al., PHYS. SOLID STATE, 52, 561-567, 2010
EXPERIMENT We have experimental dependencies:1.Tm = f(H) 2. m = f(Tm) and we would like compare these data with theoretical functions.
THEORY We have to solve the cubic equation BM3 + A(T – TC)M - H = 0 for a value of the T = Tm, which corresponds to the m, under the condition (Tm,H)/T = 2M(Tm,H)/TH = 0 RESULTS • m = 2A/(Tm-TC) • Tm= TC + bH2/3 b=3A-1(B/16)1/3
EXPERIMENT and THEORY (Tm – H2/3) PLOT
EXPERIMENT and THEORY Gd, polycrystalline ball: (1/m – Tm) PLOT m
EXPERIMENT and THEORY A.V. Korolev, M. I. Kurkin, and E. V. Rosenfel’d Phys.Solid State, Vol. 45, No. 8, 2003, pp. 1484–1486. La0.85Sr0.15MnO3 single crystal: (Tm – H2/3) PLOT
EXPERIMENT and THEORY A.V. Korolev, M. I. Kurkin, and E. V. Rosenfel’d Phys. Solid State, Vol. 45, No. 8, 2003, pp. 1484–1486. La0.85Sr0.15MnO3single crystal: (1/m – Tm) PLOT
CONCLUSION • Landau second-order phase transition theory of ferromagnetic materials describes magnetic experiments in the vicinity of the Curie temperature is not good enough. • However, only at temperatures above the Curie temperature (a few degrees), the experiments are in very good agreement with the theory. • Using the AC magnetic susceptibility method together with the theory we can find the value of the Curie temperature definitely.
MOTIVATION It has long been known (K. P. Belov, Magnetic Transitions (Fizmatgiz, Moscow,1959; Consultants Bureau, New York, 1961) that temperature dependence of differential susceptibility has the maximum at T = Tm, which move from Tc to high temperature region with increasing field
MOTIVATION • Nonlinear effects are decreasing with increasing temperature and Landau's theory is working better and better with increasing temperature. • We guess that the theory should be effective at temperature more than Curie temperature.
“kink-point method” I.K. Kamilov, Kh.K. Aliev “Second-order phase transitions in ferromagnetic materials in weak fields near the Curie point”UFN,26, 696–712 (1983). (И.К. Камилов, Х.К. Алиев, УФН, 140N4, с. 639, 1983)
I.K. Kamilov, Kh.K. Aliev “Second-order phase transitions in ferromagnetic materials in weak fields near the Curie point” 26 696–712 (1983) И.К. Камилов, Х.К. Алиев, УФН, 140N4, с. 639, 1983
EXPERIMENT and THEORY m Gd, polycrystalline ball m
Magnetization curve from the ferro- or ferrimagnetic samples with very low coercive force HC << HS and anisotropy field HA << HS (points - experiment; straight line – theory [. ).
Field dependence of the AC magneticsusceptibility of gadolinium