Download
1 / 23
230 likes | 308 Views
Learn about statistical "distinction coefficient" and profile searching methods to analyze gene expression differences in KO and WT uninvolved tissues. Use these techniques for clustering and Ingenuity pathway analysis.

E N D
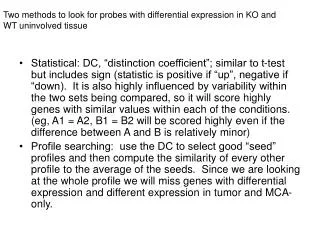
Two methods to look for probes with differential expression in KO and WT uninvolved tissue • Statistical: DC, “distinction coefficient”; similar to t-test but includes sign (statistic is positive if “up”, negative if “down). It is also highly influenced by variability within the two sets being compared, so it will score highly genes with similar values within each of the conditions. (eg, A1 = A2, B1 = B2 will be scored highly even if the difference between A and B is relatively minor) • Profile searching: use the DC to select good “seed” profiles and then compute the similarity of every other profile to the average of the seeds. Since we are looking at the whole profile we will miss genes with differential expression and different expression in tumor and MCA-only.
Arrangement for k-means clustering WT KO T Uninv MCA T T Uninv MCA
Statistical method: Distinction coefficient • Compute DC for two groups: A = WT uninvolved tissue, B = KO uninvolved tissue. • DC values range from -50 to 60 (generally anything over 3 is interesting, however i tend to have 3-5 in each group) • Select profiles with either WT > KO in uninvolved tissue, or the reverse. • This does not consider expression in the other samples.
i’m interested in the degree to which IPA can find networks in “non-related” genes • Select 36 genes, four from each profile, that have different expression patterns in the data set we are looking at. • Run IPA, and find two networks with a dozen genes each. • Possibly this is a lower bound for interpreting IPA results, eg we should expect to get a network with a dozen genes no matter what the input; • Thus we’d look at the biology of the genes + network to determine what it means rather than on the simple fact that we see a network relating several genes from the input set.
Possibly these genes are actually biologically related, so... • Open the annotation for the array on netaffx, and select the first 100 genes. • IPA analysis follows....
IPA analysis of first 100 probe sets listed in mouse array on netaffx