Download
1 / 41
420 likes | 545 Views
Differential Expression II. Adding power by modeling all the genes Oct 06. Linear Model for Several Conditions. Y ij = m + a i + error ij m is the mean expression for the gene over the entire experiment.

E N D
Differential Expression II Adding power by modeling all the genes Oct 06
Linear Model for Several Conditions Yij = m + ai + errorij m is the mean expression for the gene over the entire experiment. ai is the deviation of the mean of the ith condition from the overall mean Si ai=0 Notice that this is a model for 1 gene at a time.
A basic feature of models The more items we estimate from the data, the less precisely we can do the estimation. The fewer items we estimate from the data, the more we have to rely on the correctness of the model. e.g. Yij = m + ai + errorij Because we are interested in hypotheses about the means, and are less interested in thevariability, we often assume that the variability does not depend on the treatment. When we do an analysis, we check this assumption, but we do not worry about small violations.
A basic feature of models Because we are interested in hypotheses about the means, and are less interested in thevariability, we often assume that the variability does not depend on the treatment. When we do an analysis, we check this assumption, but we do not worry about small violations. For the 2-sample t-test, we have only 2 means, so if we have sufficient observations, we may allow the variability to depend on the treatment. (This is the default.) If we have only a few observations per treatment, we might assume that the variances are the same ("pooled variance") which gives more power (if the assumption is correct.)
Precision and Degrees of Freedom The precision of t and F tests is determined in part by the (error) degrees of freedom. Assuming constant variance gives more d.f. t - distributions F - distributions
Adding Power by Modeling The main idea: Since differential expression focuses on differences in means, use a model for the variance that uses data from all the genes. 1) all genes have the same variance under all treatments (frequentist) 2) the variances have a known distribution (Bayesian) 3) the variances have a distribution that can be estimated (Empirical Bayes) 4) regularization or shrinkage - combine information from individual genes with information from all the genes
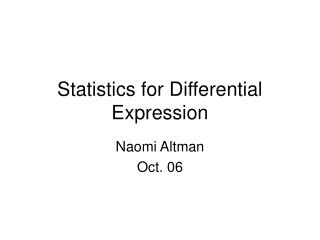
Adding Power by Modeling 1) all genes have the same variance under all treatments (frequentist) expression log2(expression)
Adding Power by Modeling We could assume that Var(yij) = s2mij Then the t-test would be as a function of mean where we would use a pooled estimate over all genes to estimate s2
Adding Power by Modeling We could assume that Var(yij) = s2 or Var(yij) = s2mij E.g. with 2 treatments and 2 samples per treatment, we have only (n+m-2)=2 d.f. for the usual t-test. If we use the pooled estimate of variance, we obtain 2 x number genes d.f. for the test (practically infinite)
Adding Power by Modeling This leads to Bayes and Empirical Bayes models. Bayes: We assume that we know the distribution before we even see the data. Empirical Bayes: We assume a shape for the distribution (e.g. Normal or a multiple of a chi-square) and estimate parameters such as the mean and variance or we use a smoothed version of the sample histogram as a distribution
The Effect of (Empirical) Bayes Let Sp2 be the (estimate of the) mean of the prior. Then the (empirical) Bayes estimate of variance of X is a weighted average of Sx2 and Sp2 and similarly for Y. The associated d.f. for is a weighted average of the d.f. of Sx2 (sample size -1) and the pooled variance (the d.f. depend on the model for the prior). The t-test then becomes: I am not aware of any software that uses the formula here, as the software assumes that the variance depends on the gene, but not on the treatment
Adding Power by Regularization The idea comes from what is called regularization in matrix inversion - adding a small constant before taking inverses to avoid dividing by numbers close to zero. So, we might replace Sx2 by Sx2+s where s is some small number. What number should be chosen? Usually s is based on the histogram of within gene variances, so this method is similar to empirical Bayes But: there are no d.f. associated with the estimate, so resampling (permutation or bootstrap) is used to estimate the null distribution.
Some Available Software MAANOVA: available for Matlab and in Bioconductor Fits a very general ANOVA model with fixed and random effects with the following options: a) a variance for each gene b) all genes have the same variance c) regularized variance estimate
Some Available Software SAM: available for Excel samr: in Bioconductor Fits a few ANOVA models and a survival model using a regularized test statistic and a null distribution based on permutations (simple interface in Excel)
Some Available Software CyberT: http://visitor.ics.uci.edu/genex/cybert/ Fits paired, 2-sample and one-way ANOVA models using a full Bayesian model Can be run on a web interface, or you can download the R code.
Some Available Softwarein Bioconductor Limma: Fits an empirical Bayes model based on modeling the variances for each gene as Sp2Chi-squared, where Sp2 and the d.f. are estimated from the data. Allows 1 random effect estimated as a fraction of the variance.
Some Available Softwarein Bioconductor LPE: Estimates the variance of each gene as a function of the mean expression level multtest: does permutation tests based on t and F statistics (including regularized versions) geneTS: for time-course experiments
Some Other DE Softwarein Bioconductor EBayes: Bioconductor LMGene:
Multiple Comparisons Regardless of our choice of analysis method, the end result is a measure of statistical significance for each gene. For frequentist methods, the measure is: P(observed test statistic| H0 is true) For Bayesian methods, the measure is P(H0 is true | observed data)
Multiple Comparisons To understand the multiple comparisons problem, we start with the p-value for the ith gene: P(observed ith test statistic| H0i is true)=pi Typically, we select a cut-off such as a=.05 or a=.01 and declare that gene i differentially expresses (reject H0i) if pi≤ a
Types of Error m=number of genes m0= number of genes that do not differentially express R=number of genes for which we reject H0 If we test at level a, E(V)=am0 e.g. a=0.05 b=0.8 m=10,000 m0=9000 E(V)=0.05*9000=450 E(U)=0.2*1000=200 Most MC procedures focus on V If is the average power is b, E(U)=b(m-m0)
3.5 main ideas (x 2) 1. Family-wise error rate: adjust the value of a to force P(V>0) ≤ a* some predefined level such as .05 or .01 2. False discovery rate: choose a value of a (estimated from the data) to keep E(V/R) ≤ f* some predefined level such as .05 or .01 3. Estimate m0 (or p0 = m0/m) from the data, and then apply 1 or 2. 3.5. Pick aand report the estimate of f*.
3.5 main ideas (x 2) 1. Family-wise error rate: adjust the value of a to force P(V>0) ≤ a* some predefined level such as .05 or .01 2. False discovery rate: choose a value of a (estimated from the data) to keep E(V/R) ≤ f* some predefined level such as .05 or .01 3. Estimate m0 (or p0 = m0/m) from the data, and then apply 1 or 2. 3.5. Pick aand report the estimate of f*. x2 Apply the same ideas to the false negatives
Family-wise Error Rate adjust the value of a to force P(V>0) ≤ a* some predefined level such as .05 or .01 The best-known method is the Bonferroni method. If you are doing m tests, use a= a*/m. Problem: This is much to conservative and explodes the U, the number of non-detections. The adjusted p-value is pi/m e.g. a*=0.05 m=10,000 a=a*/10000=.0000005
Family-wise Error Rate With 5 d.f., reject for p<0.05 rejects when |t*|>2.57 reject for p<.0000005 rejects when |t*|>20.59 If we can estimate m0 we only need to adjust by dividing by m0 which provides a slight improvement. e.g. m0=9000 reject when |t*|>20.16 e.g. a*=0.05 m=10,000 a=a*/10000=.0000005
False Discovery Rate FDR=E(V/R) where V/R==0 if R=0. There is a related method called the positive FDR pFDR=E(V/R | R>0)
Controlling False Discovery Rate Benjamini and Hochberg (1995) If the p-values are independent, then the following procedure controls the FDR at level f Sort the p-values: p(1)≤p(2) ... ≤p(m) Let k be the largest value of i for which p(i) ≤ if/m. We then reject all the hypotheses with p-value ≤ p(k) (BH method) Benjamini and Hochberg (2000) Same procedure with an estimate of m0 Benjamini and Yekutieli (2001) The BH procedure works with some types of dependent tests. The BH procedure works with arbitrary dependency if we replace f by f/S(i/m)≈ f/ln(m) (Compare with Bonferroni)
Estimating pFDR Storey and Tibshirani (2001) Let n0 be an estimate of m0. An estimate of pFDR = a n0/R if we reject for p<a. They also introduced the q-value - for each observed value of p, the q-value is the largest estimated pFDR if we reject for smaller p-values. The q-value (or the FDR equivalent) is sometimes called an adjusted p-value, but it is not a p-value=prob(observed|H0) The pFDR cannot be "controlled" because Pr(R=0)≠0, but it is readily estimated.
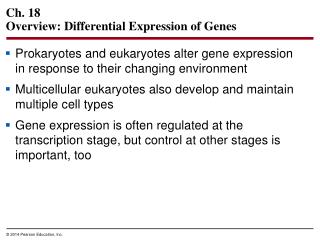
Estimating m0 When m0=m, all the genes are independent, and the test statistics follow the theoretical null distributions, the p-values are uniformly distributed. When m0<m the differentially expressed genes tend to have smaller p-values
Estimating m0 When m0<m the differentially expressed genes tend to have smaller p-values. The flat part of the histogram is used to estimate m0. There are several methods, and they work quite well as long as the peak near zero is sharp.
Problems in estimating m0 and FDR When the power is low (small sample size or noisy data) we may estimate m0=m and FDR>50% even for the smallest p-value. Even if we estimate m0<m (so m-m0 genes DE) we will not "detect m-m0 genes. If m0 is very small, there may not be a large enough flat region of the histogram for estimation. Occasionally, the distribution of p-values is bi-modal - probably due to the distribution of expression too far from normal.
Bayesian Methods and Local FDR So far, we have discussed Bayesian ANOVA methods which use a prior for the expression variance. To adjust for multiple comparisons, Bayesians model the log2(expression ratio), t-value or p-value. As an example, I will show how the method works for modeling p-values.
Distribution of p-values The p-values of the nonDE genes is uniform. The p-values of the DE genes are skewed so that small p-values are more prevalent. The percentage of nonDE genes is p0=m0/m.
Distribution of p-values The distribution of p-values is pofo(p) + (1-po)f1(p). f0(p) f1(p) p0f0(p)+(1-p0)f1(p)
Bayesian Interpretation If you reject when pi<a, the FDR will be So can be thought of as a local FDR It seems like we should reject H0i when local FDR is small more importantly than when FDR is small
Frequentists, Bayesians and FDR In the same Bayesian context, and with we find that So, pFDR, the rejection region, power and the Bayesian posterior probability that the gene does not differentially expression are all connected in a way that makes intuitive sense.
Frequentists, Bayesians and q-values For each observed value of p, the q-value is the largest estimated pFDR if we reject for smaller p-values. In the same Bayesian context, the q-value is the largest probability that H0 is true, if we reject for smaller p-values. Storey 2003 Efron 2006 Obtains e-Bayes estimates of the distributions of the test statistic under the null and alternative hypotheses, defines local FDR using this Bayesian interpretation and notes the connection between local FDR and q-values.
Testing for DE and Multiple Comparisons Adjustments Most of the software previously mentioned includes the capability to incorporation FWER, FDR or some variant. Each uses a slightly different definition of these quantities. The qvalue library in Bioconductor computes variants of FDR from a list of p-values.
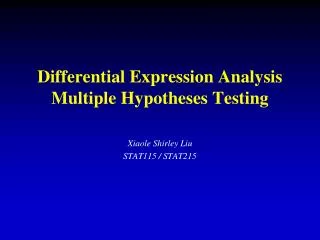
Number of genes = 68665 estimated p0= 0.5669248 estimated m-m0=29737 number of rejections if pFDR≈0.05 2619 0.1 9202 pFDR if we reject at a=0.05 pFDR≈ 0.14
Number of genes = 68665 estimated p0= 0.934315 estimated m-m0=4510 number of rejections if pFDR≈0.05 0 0.1 0 pFDR if we reject at a=0.05 pFDR≈ 0.78